
Cognitive Dashboard
The Weather Company and IBM Watson have engineered a cognitive-powered platform propelling the world forward by empowering individuals and businesses to make better, smarter decisions.

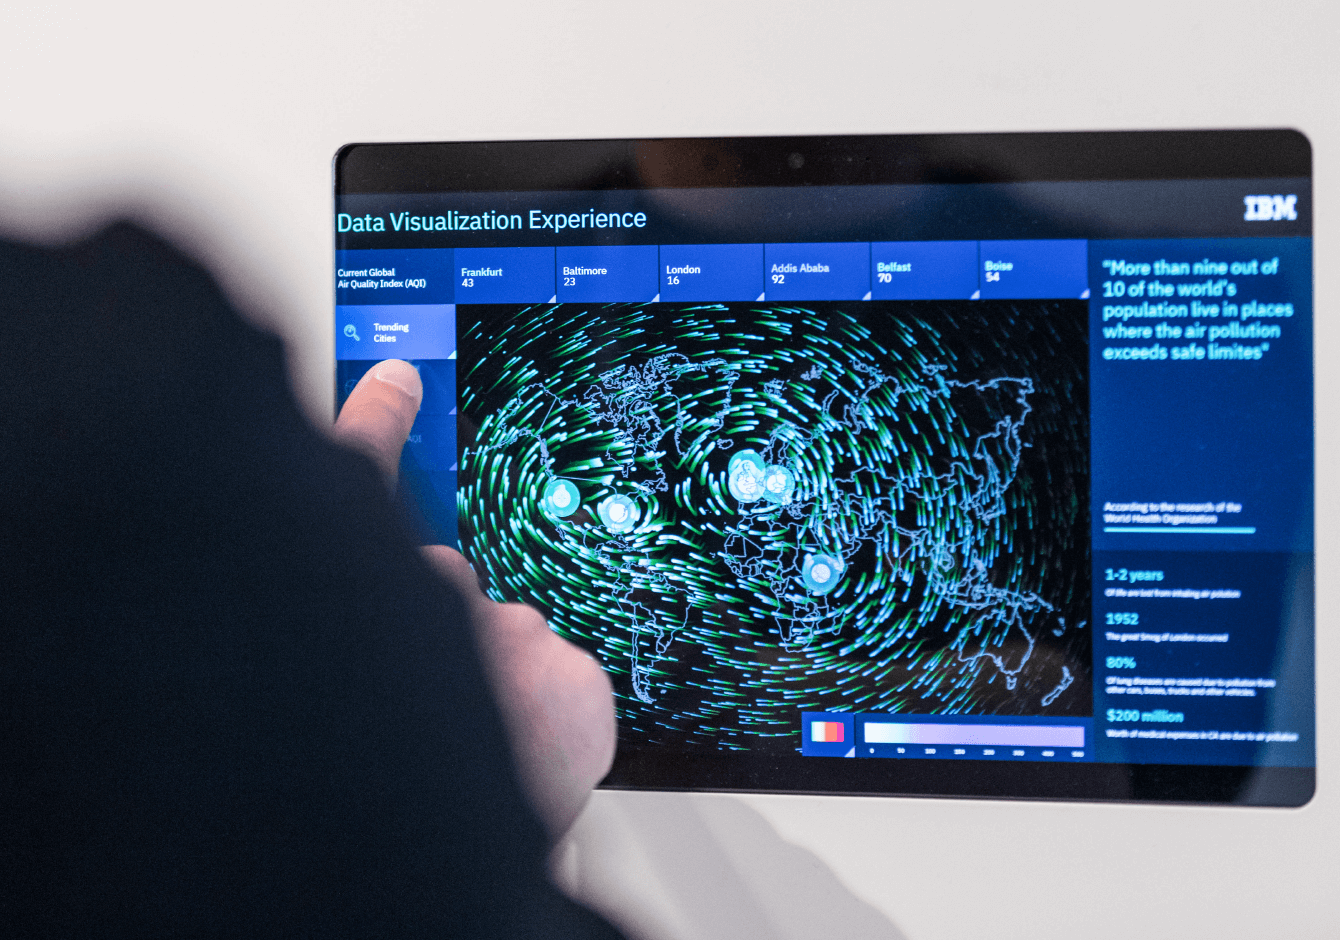
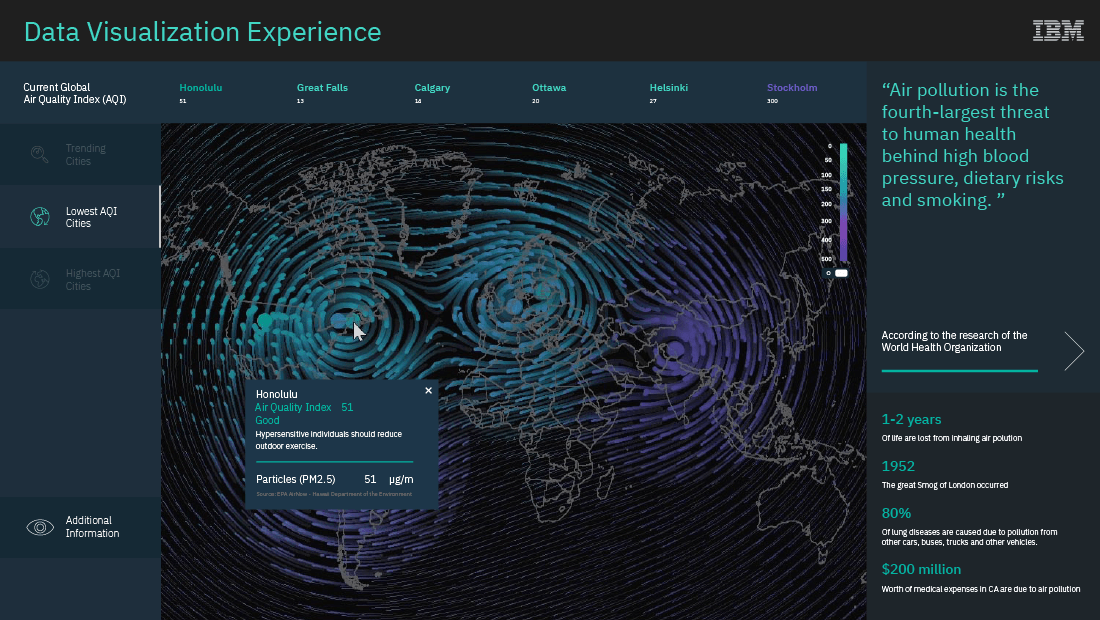
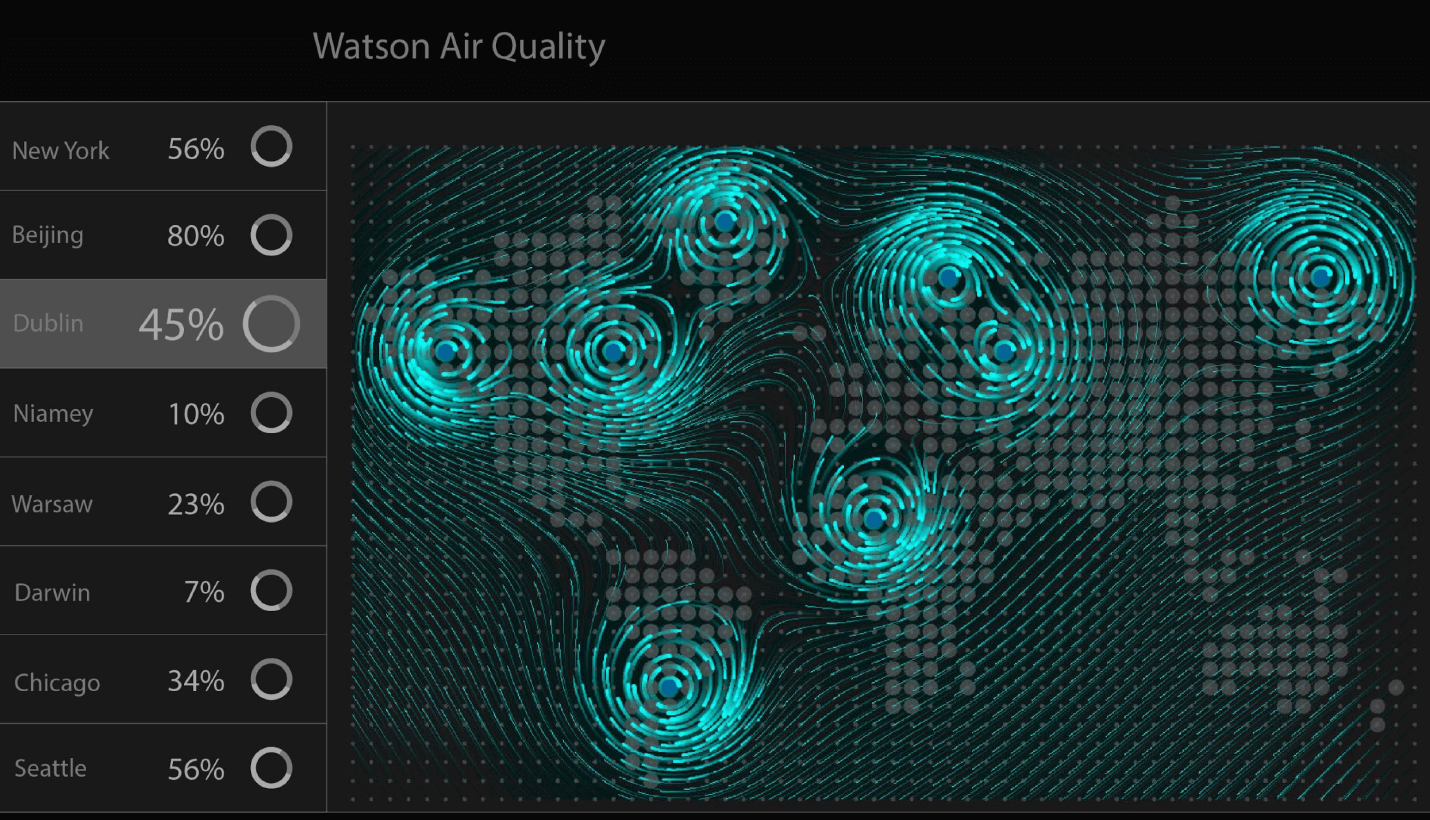
Designed a touch-based dashboard for a 15-foot interactive installation.


Inspired by weather patterns
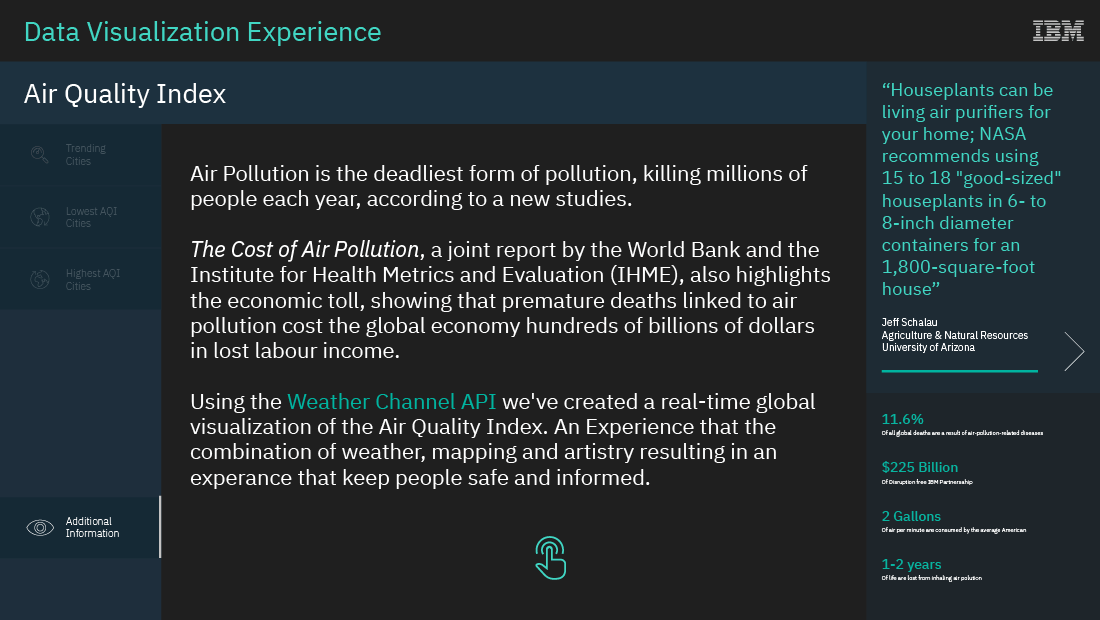
Each aluminum tile is folded and rotated to represent a field of vectors driven by currents of flow. Through a user interface integrated into the wall, visitors can select various cities based on the lowest, highest, and trending air quality across the globe. The Air Quality Index of multiple cities is analyzed and used to visualize a global air flow map. These air flow vectors are used to control the backlit LED grid.


Colors & Fonts
The Weather Channel needed custom branding, icons that would match IBM Watson’s corporate identity — used for both the dashboard and installation’s LED lights.
Default Color Palette

Alternative Color Palette

Dashboard Screen States


Wireframes and Prototypes


Client: IBM + The Weather Company
Agency: George P. Johnson + Softlabs
Software: Sketch, Invision, Draw.io, and Illustrator
Roles: Copywriting, User-interface, User-experience, and Interactive Design