IBM Sibos Interactive Wall
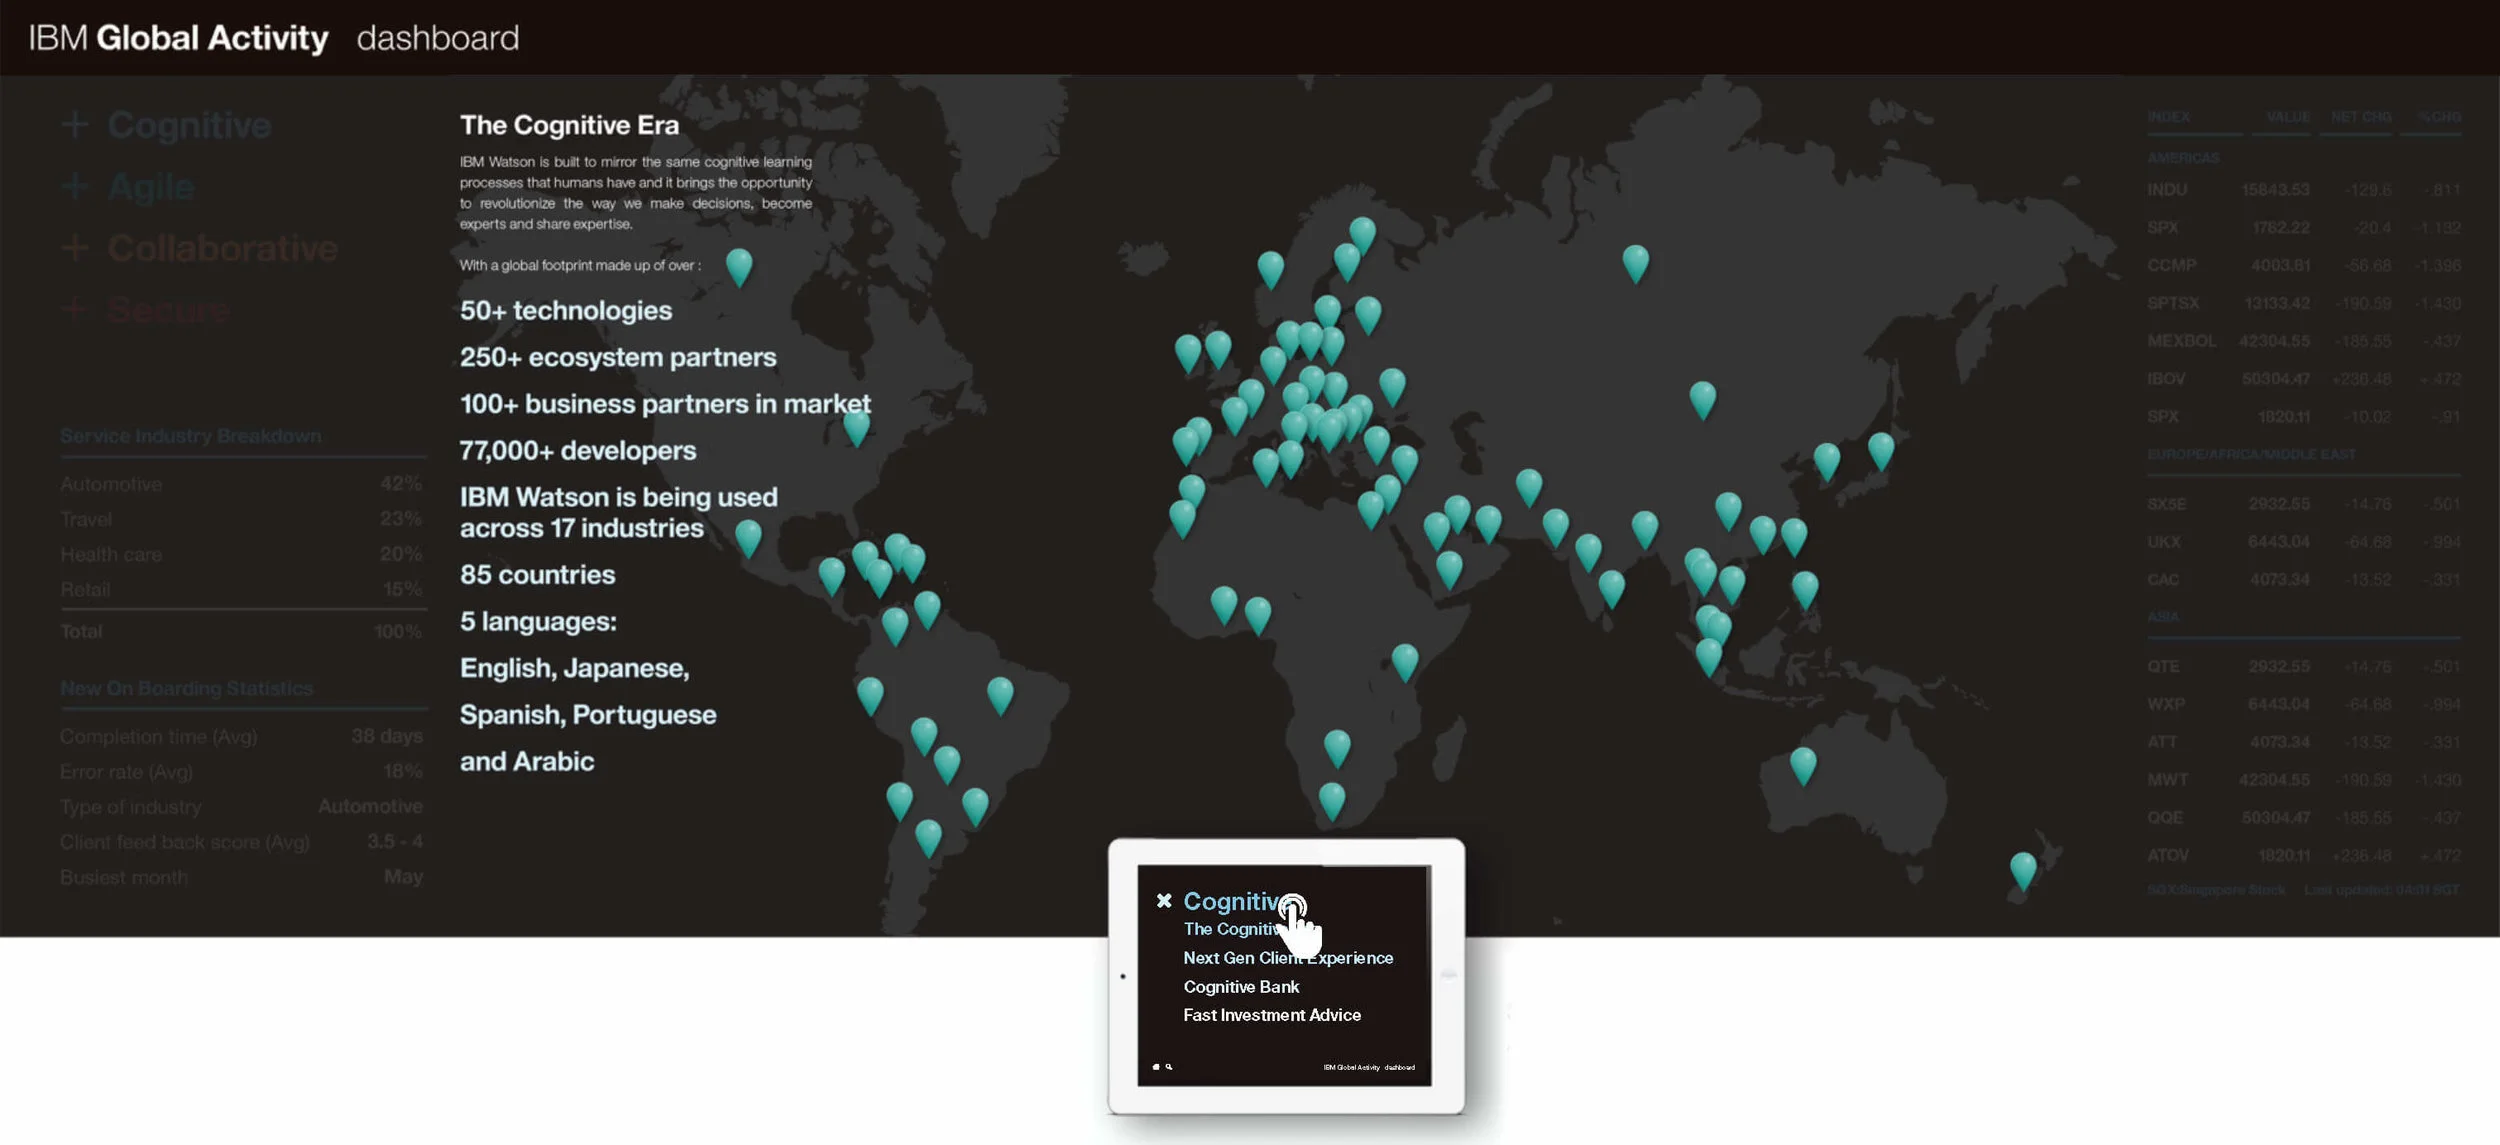
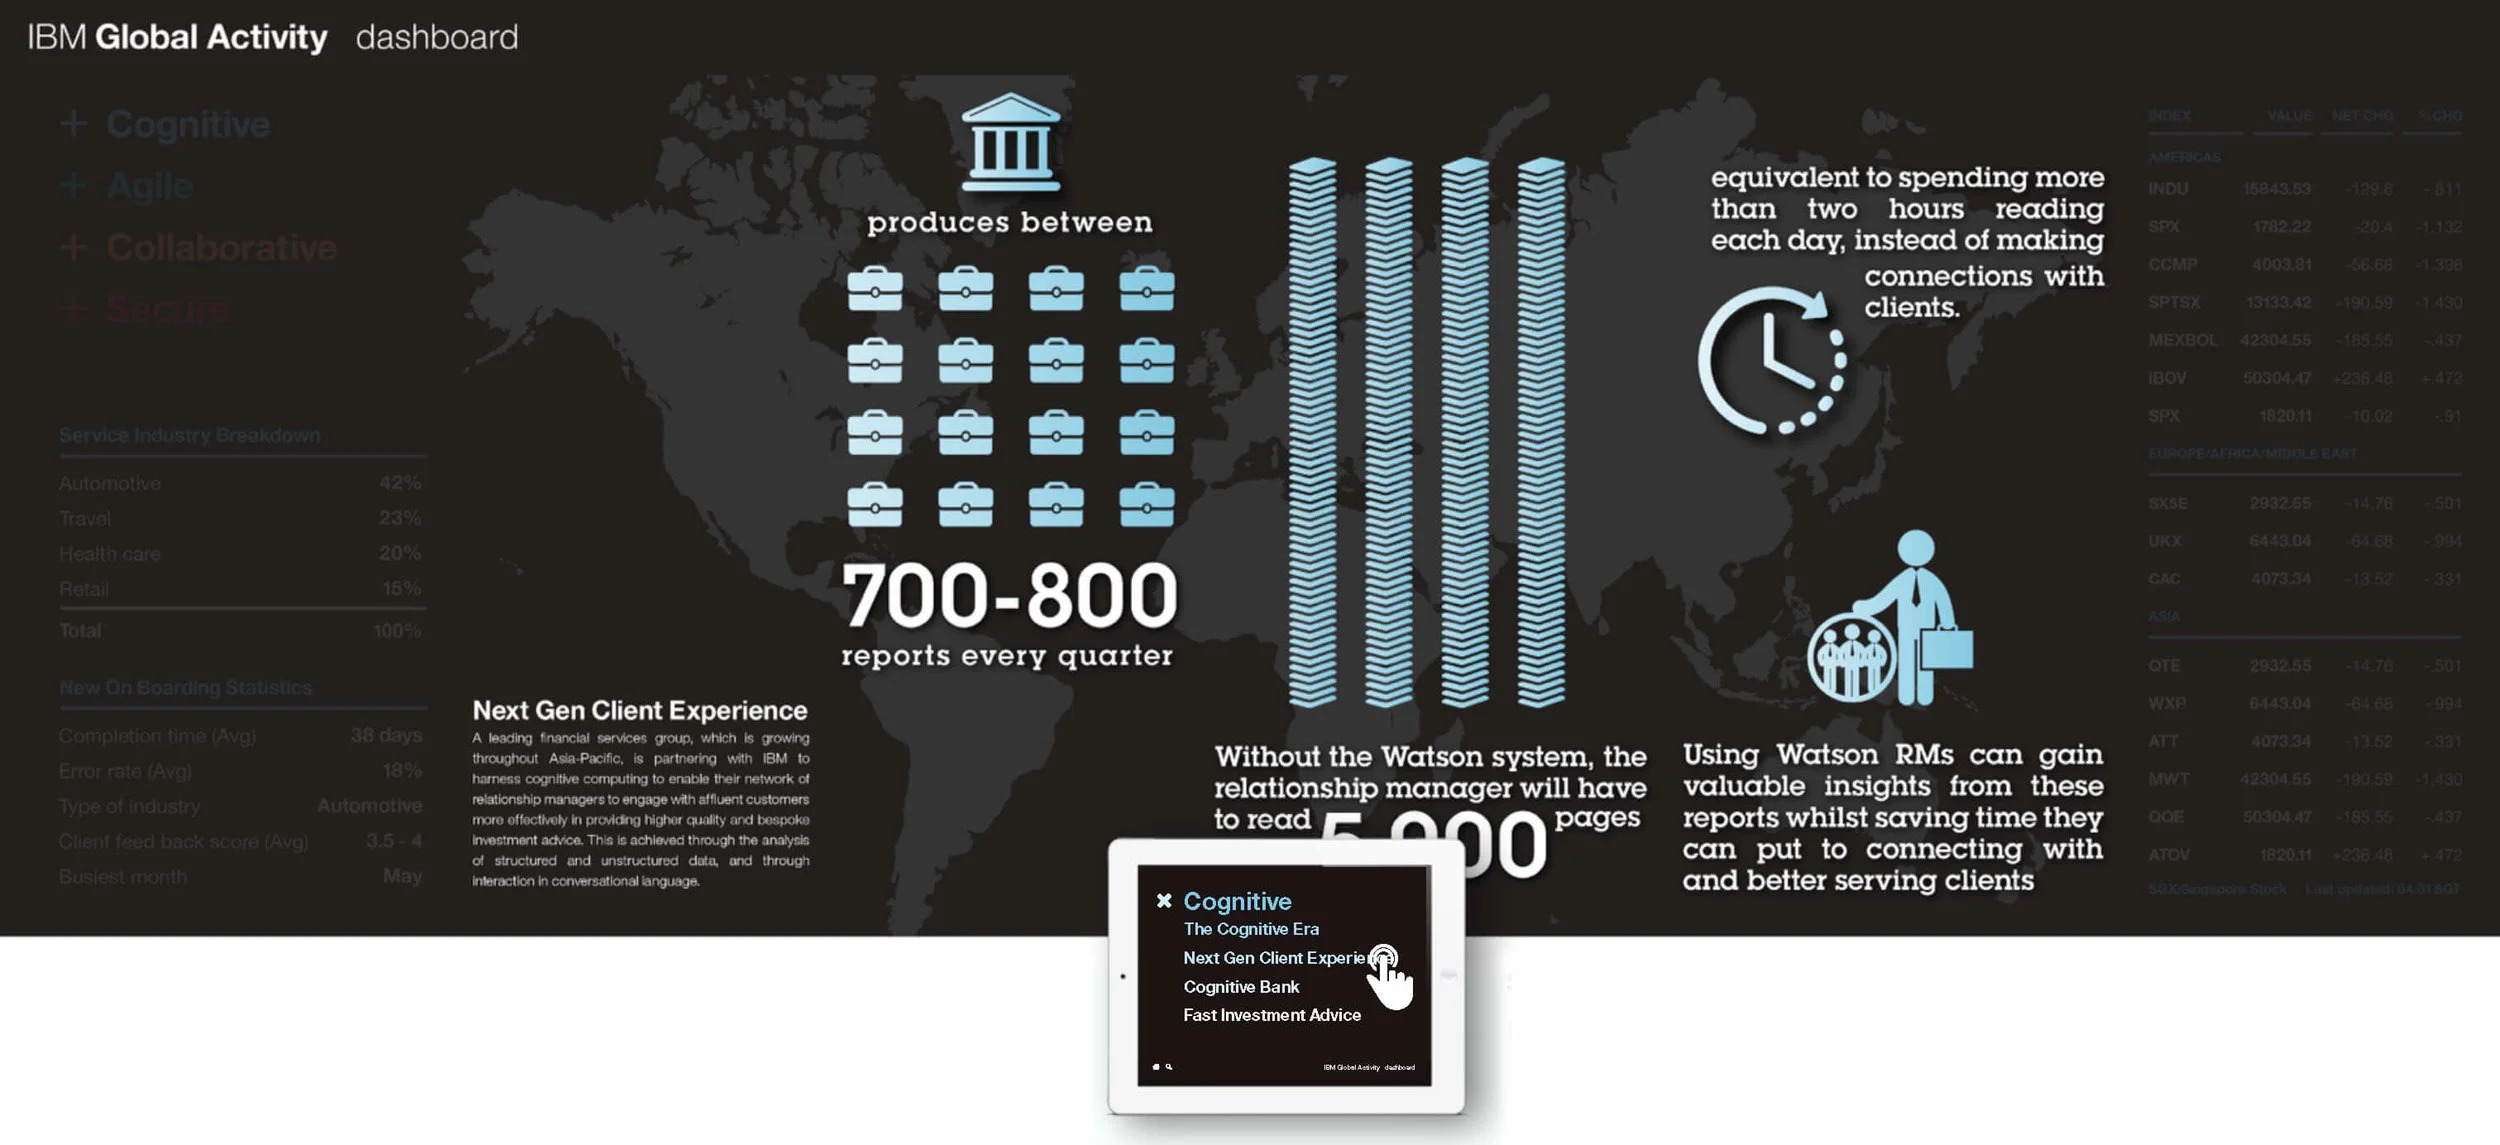
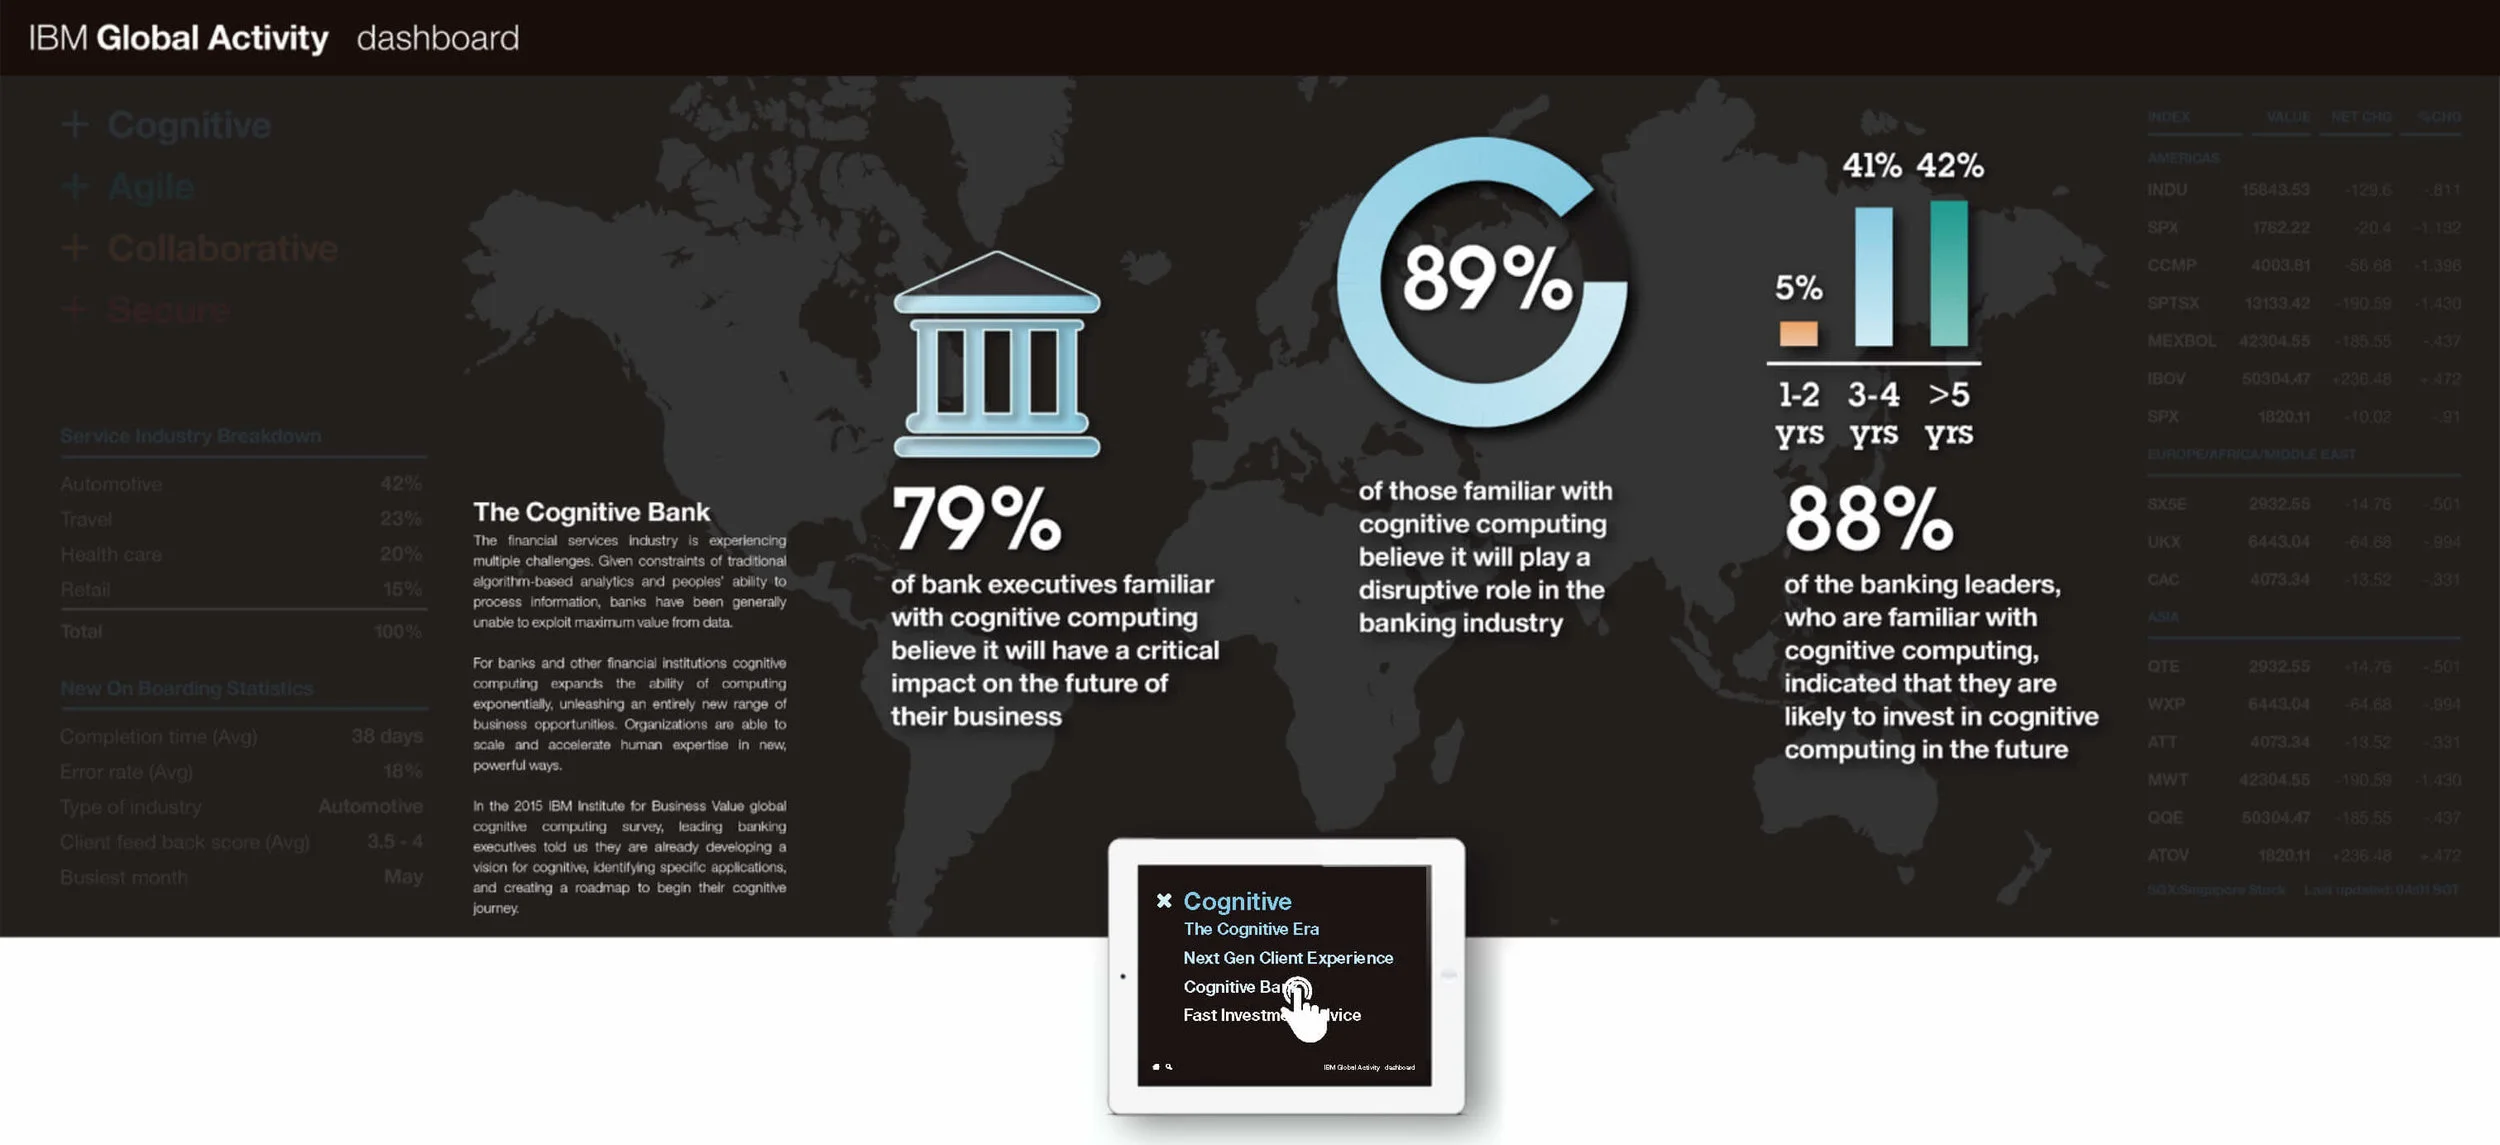
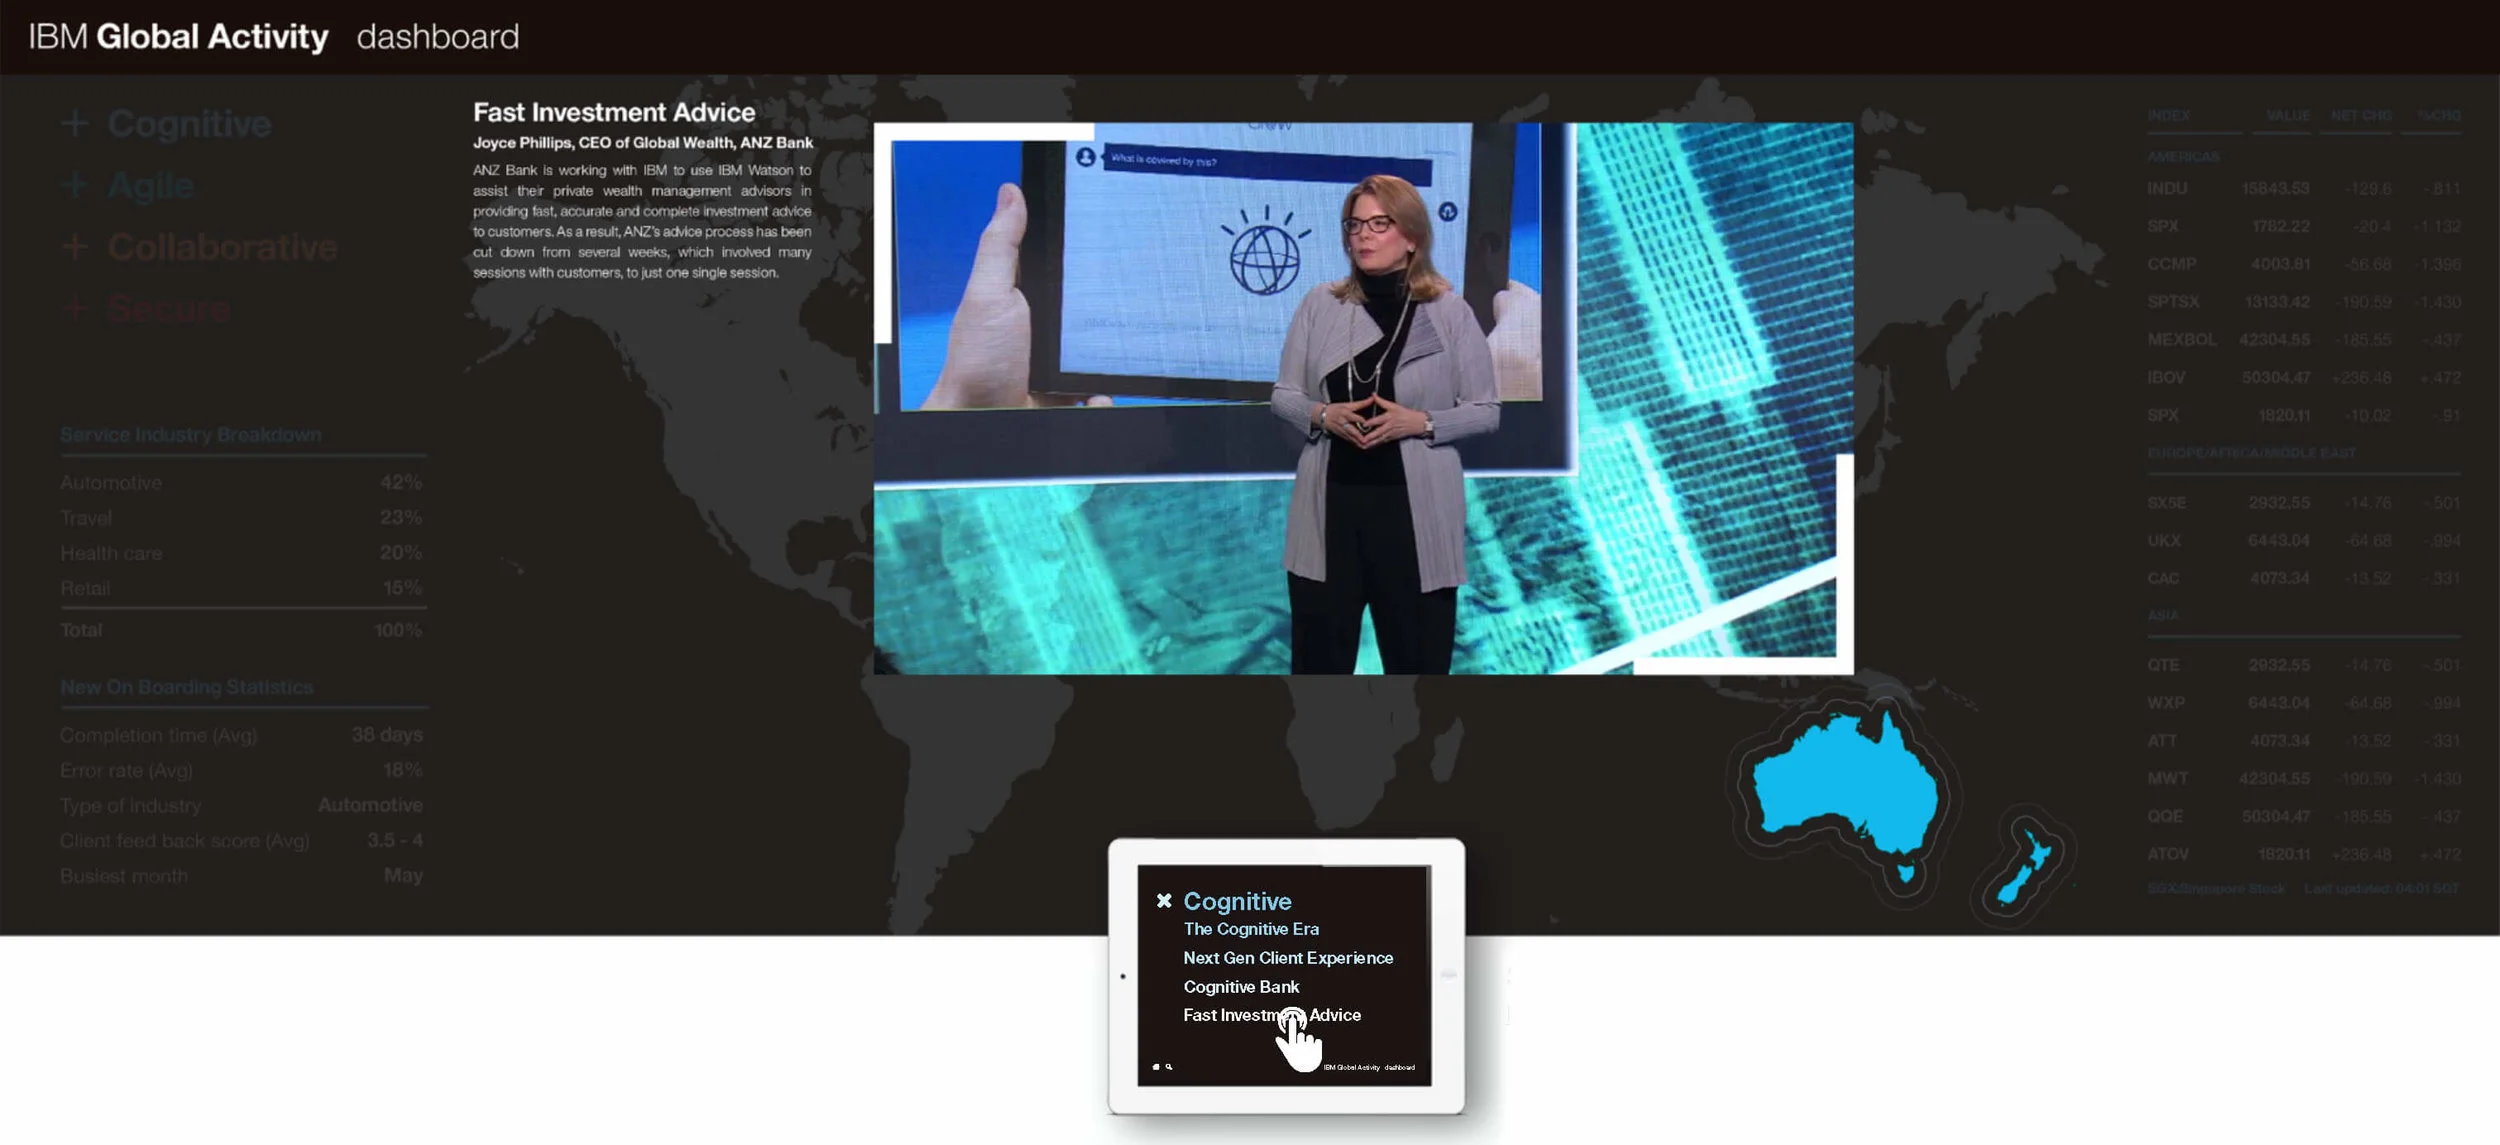
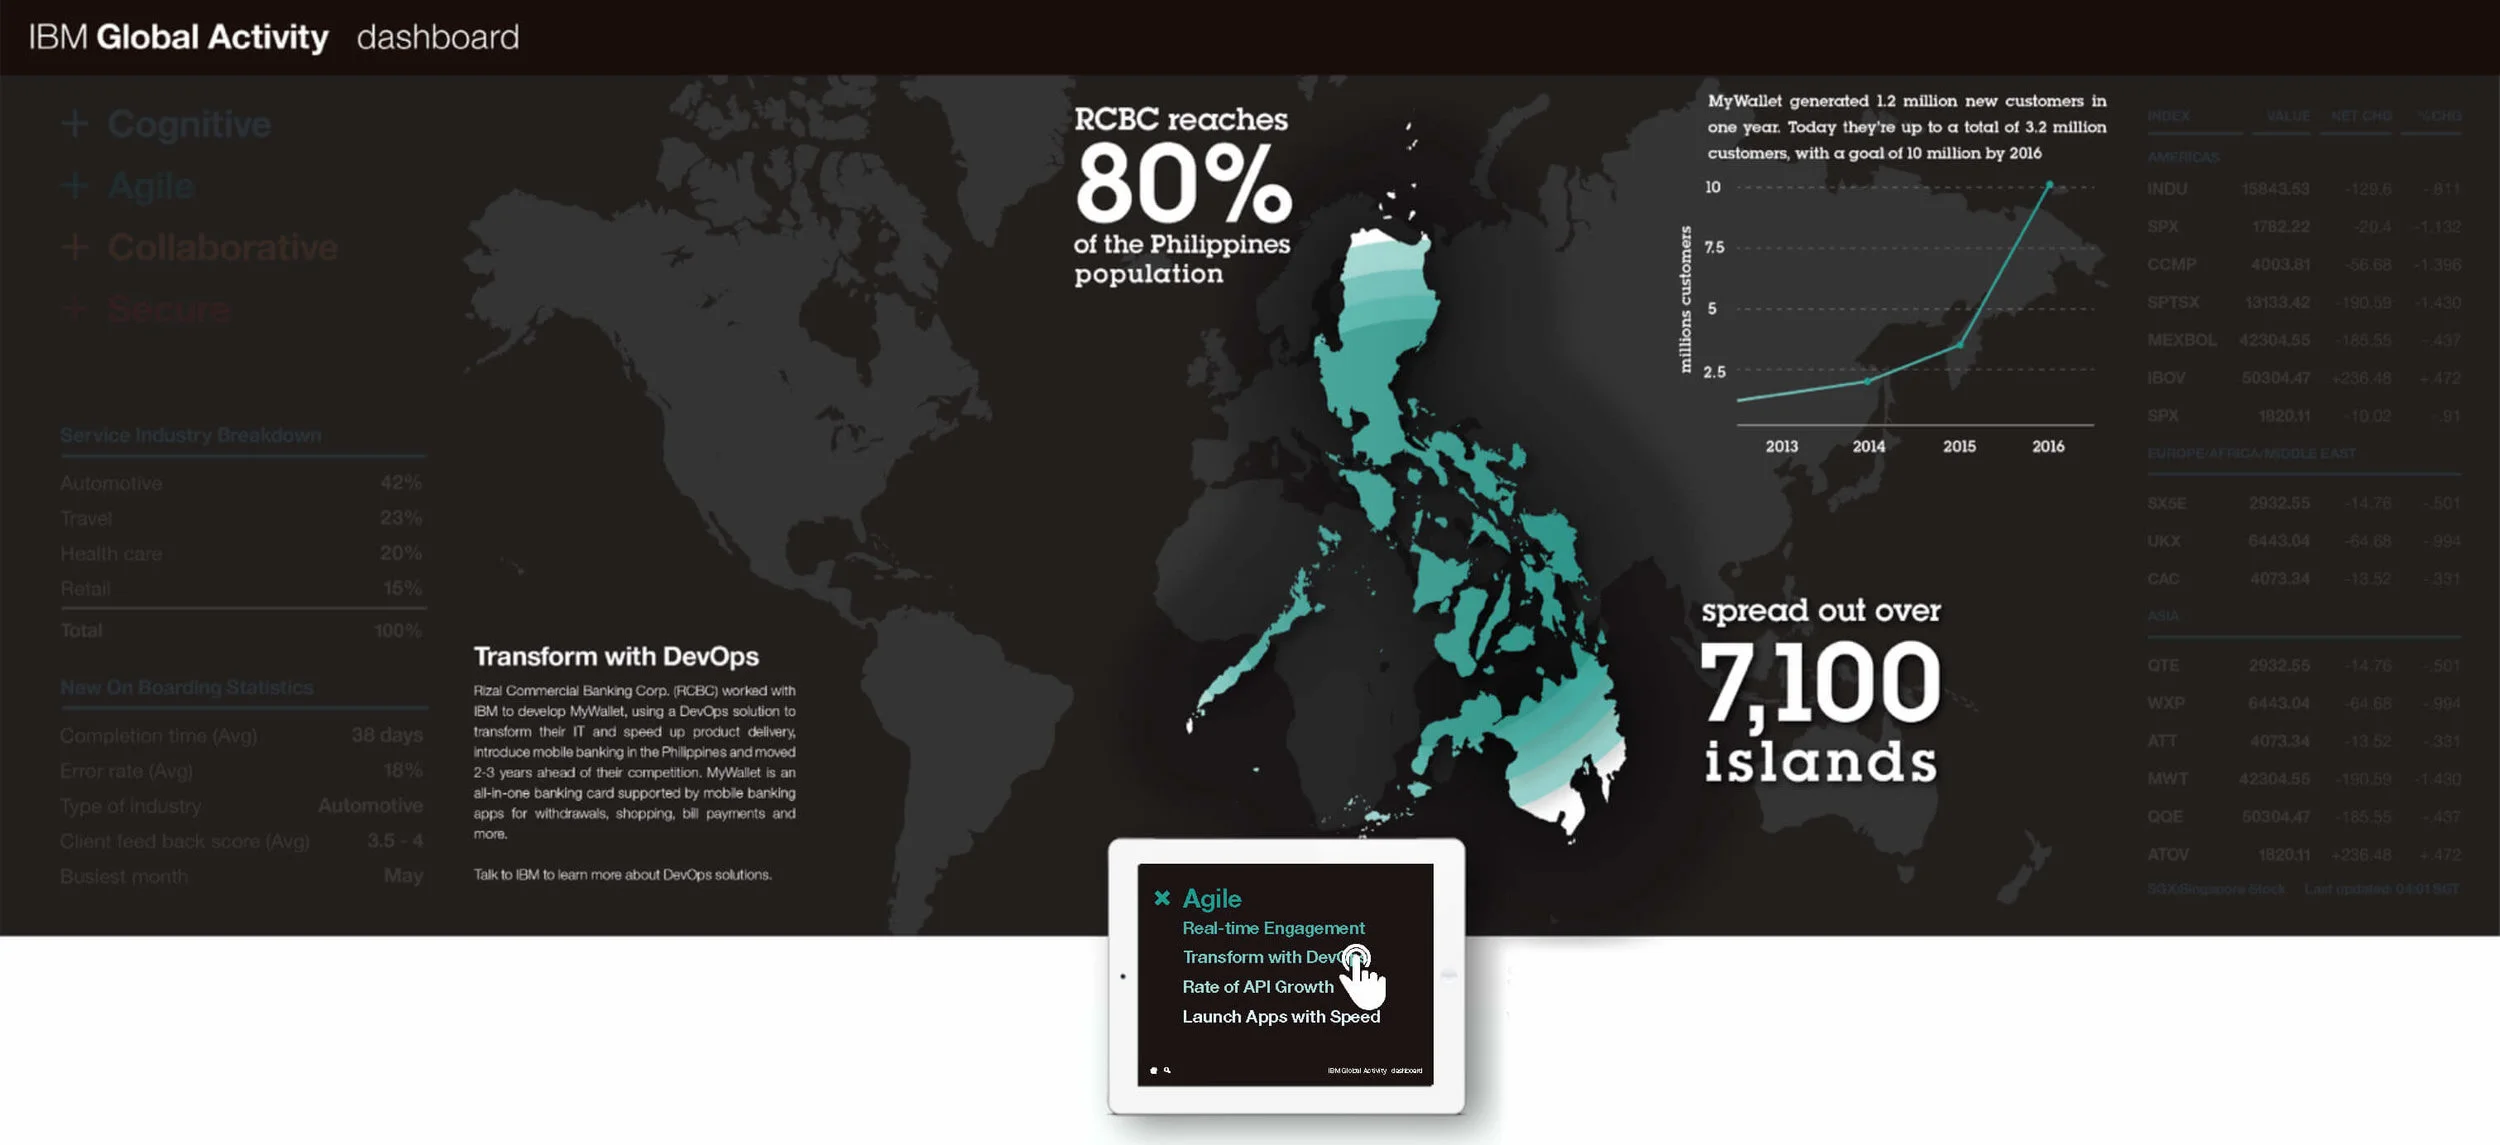
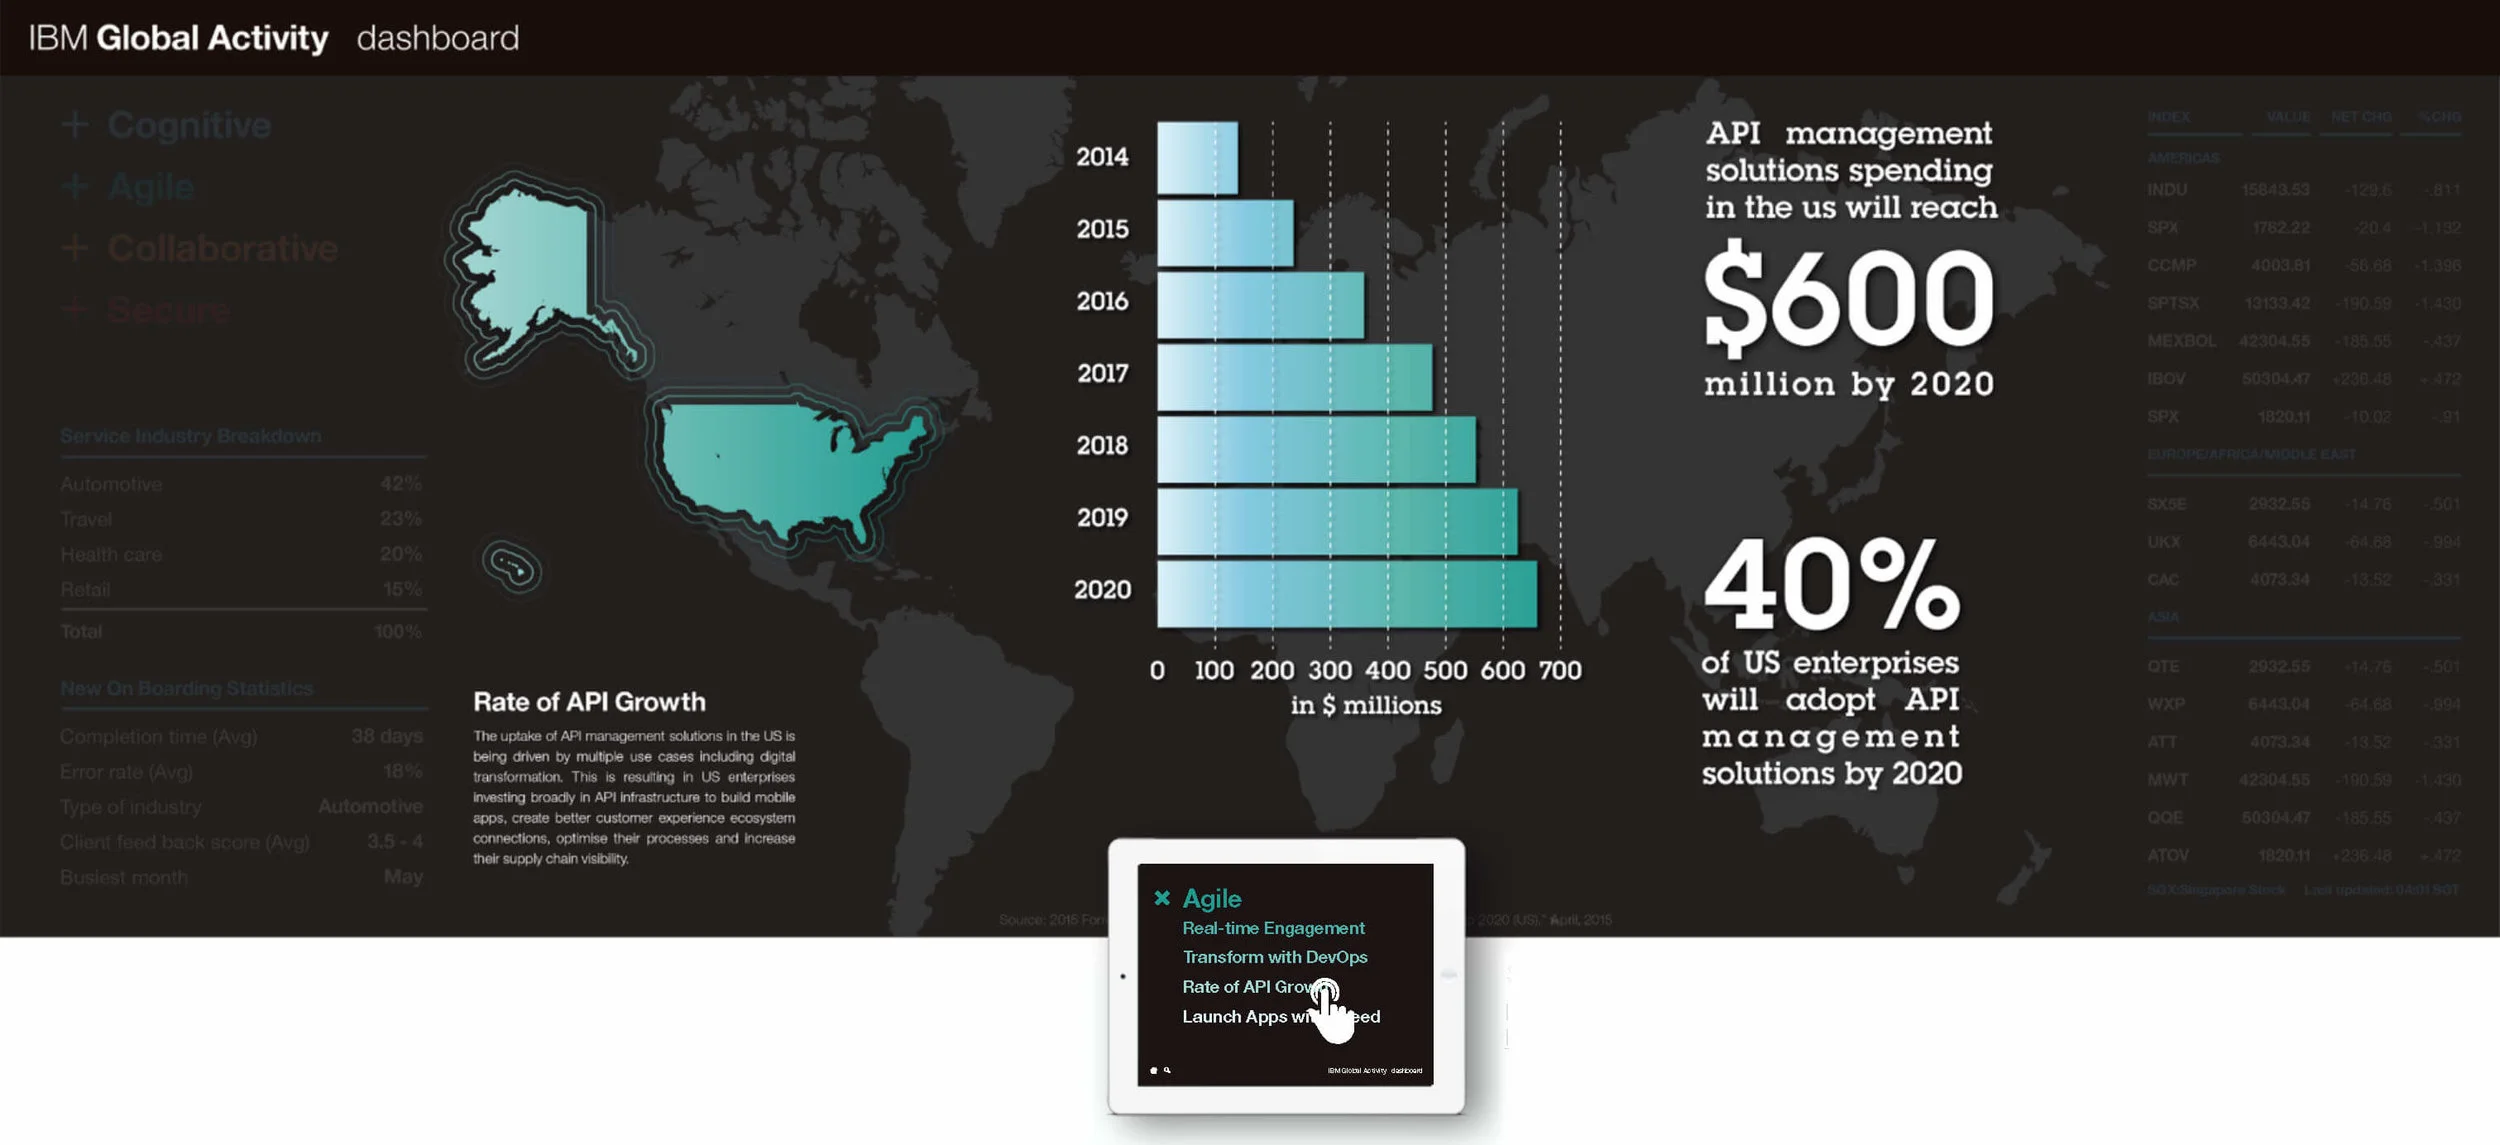
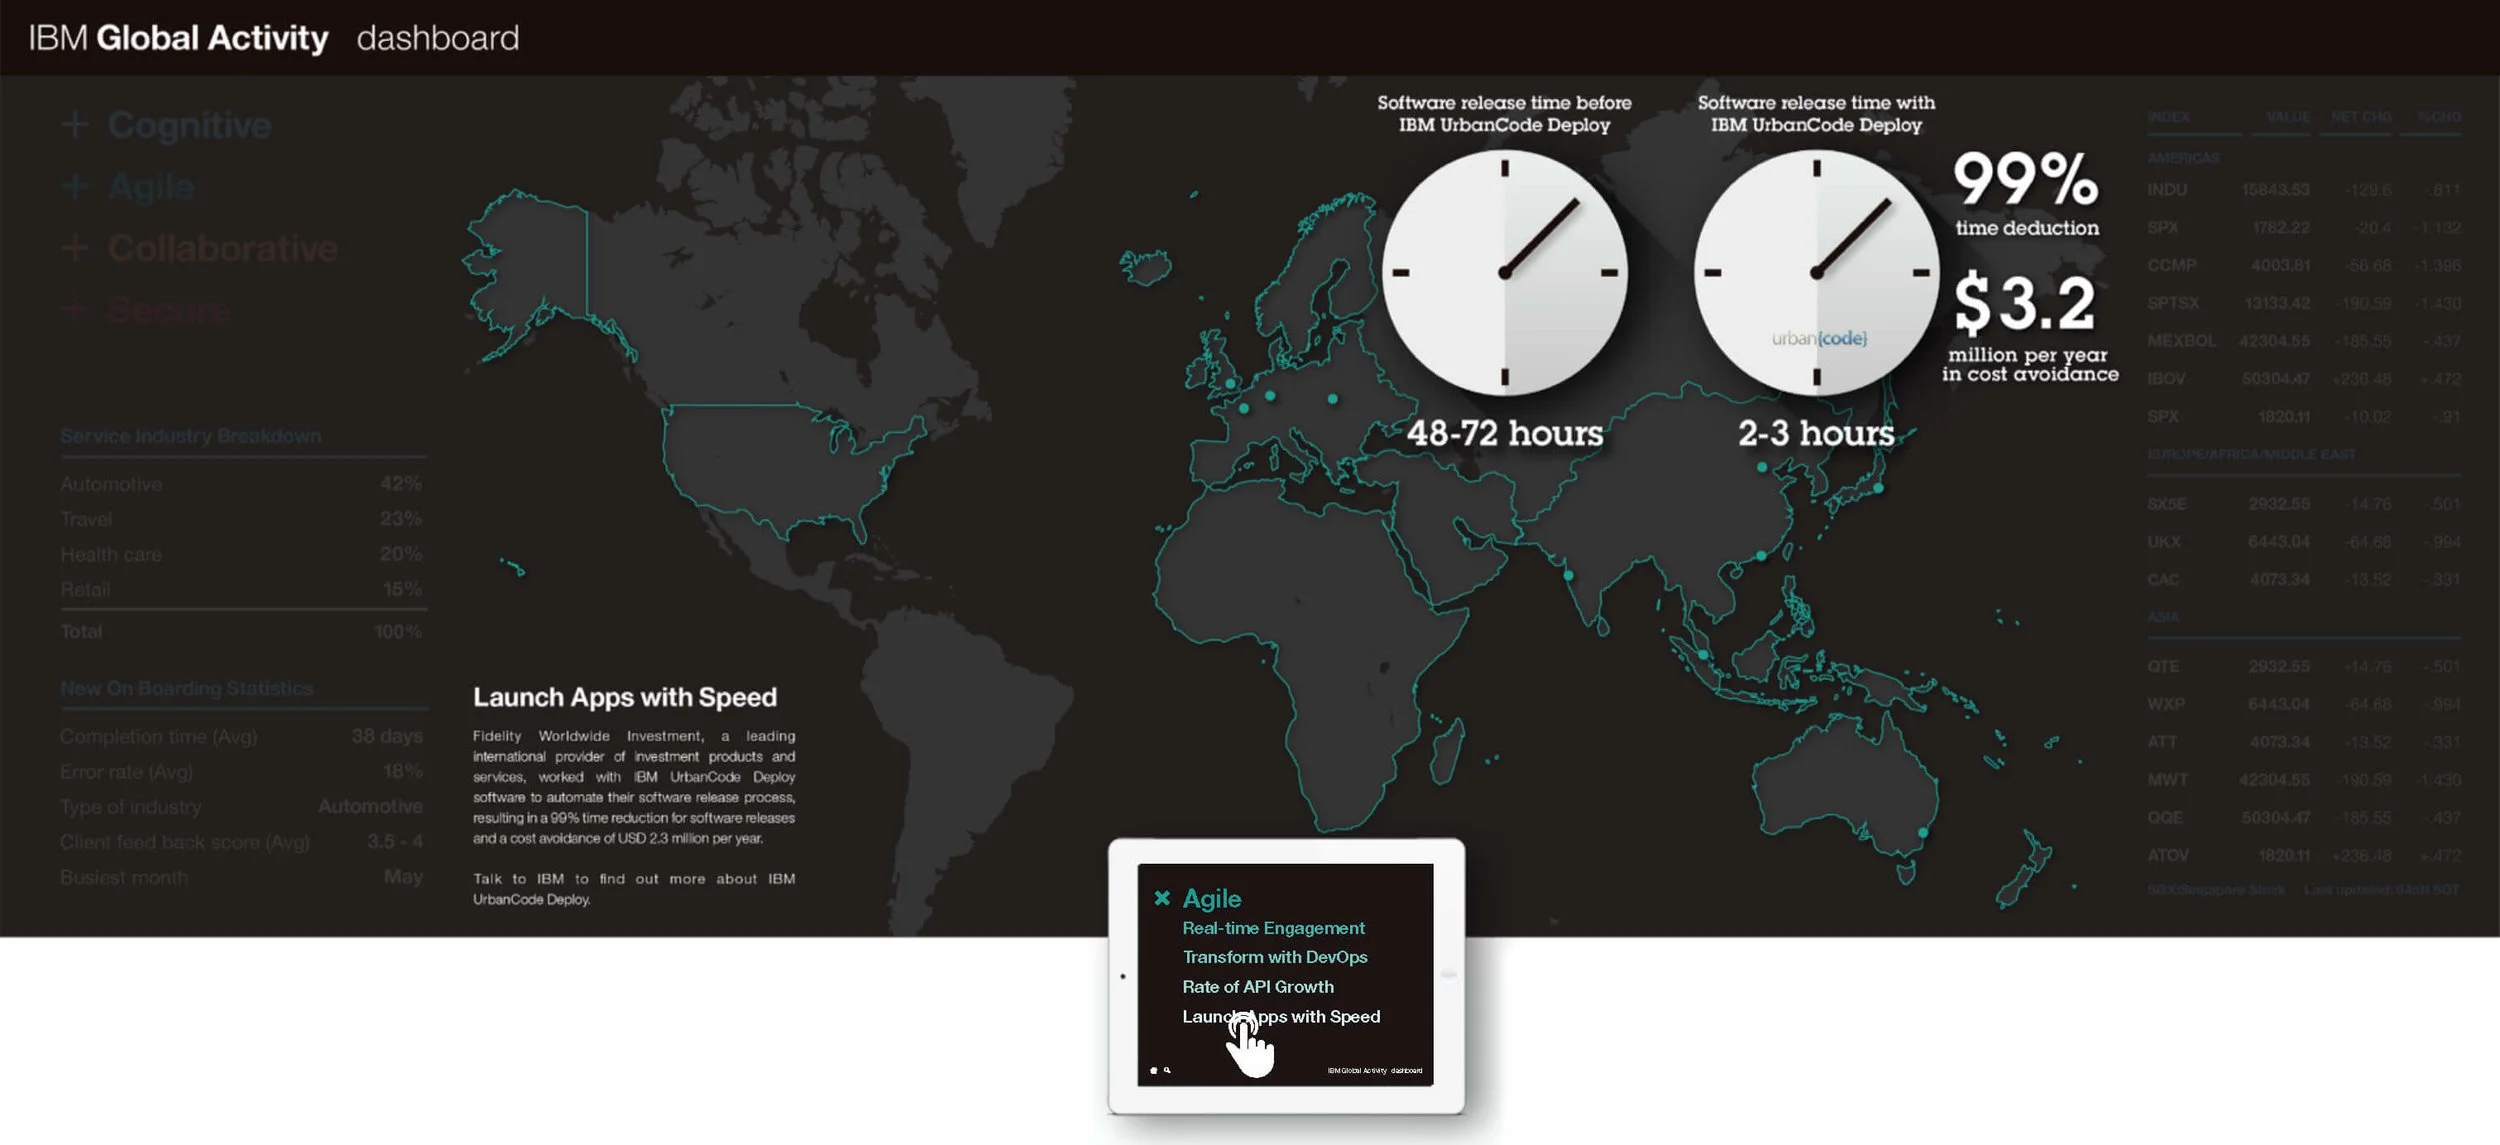
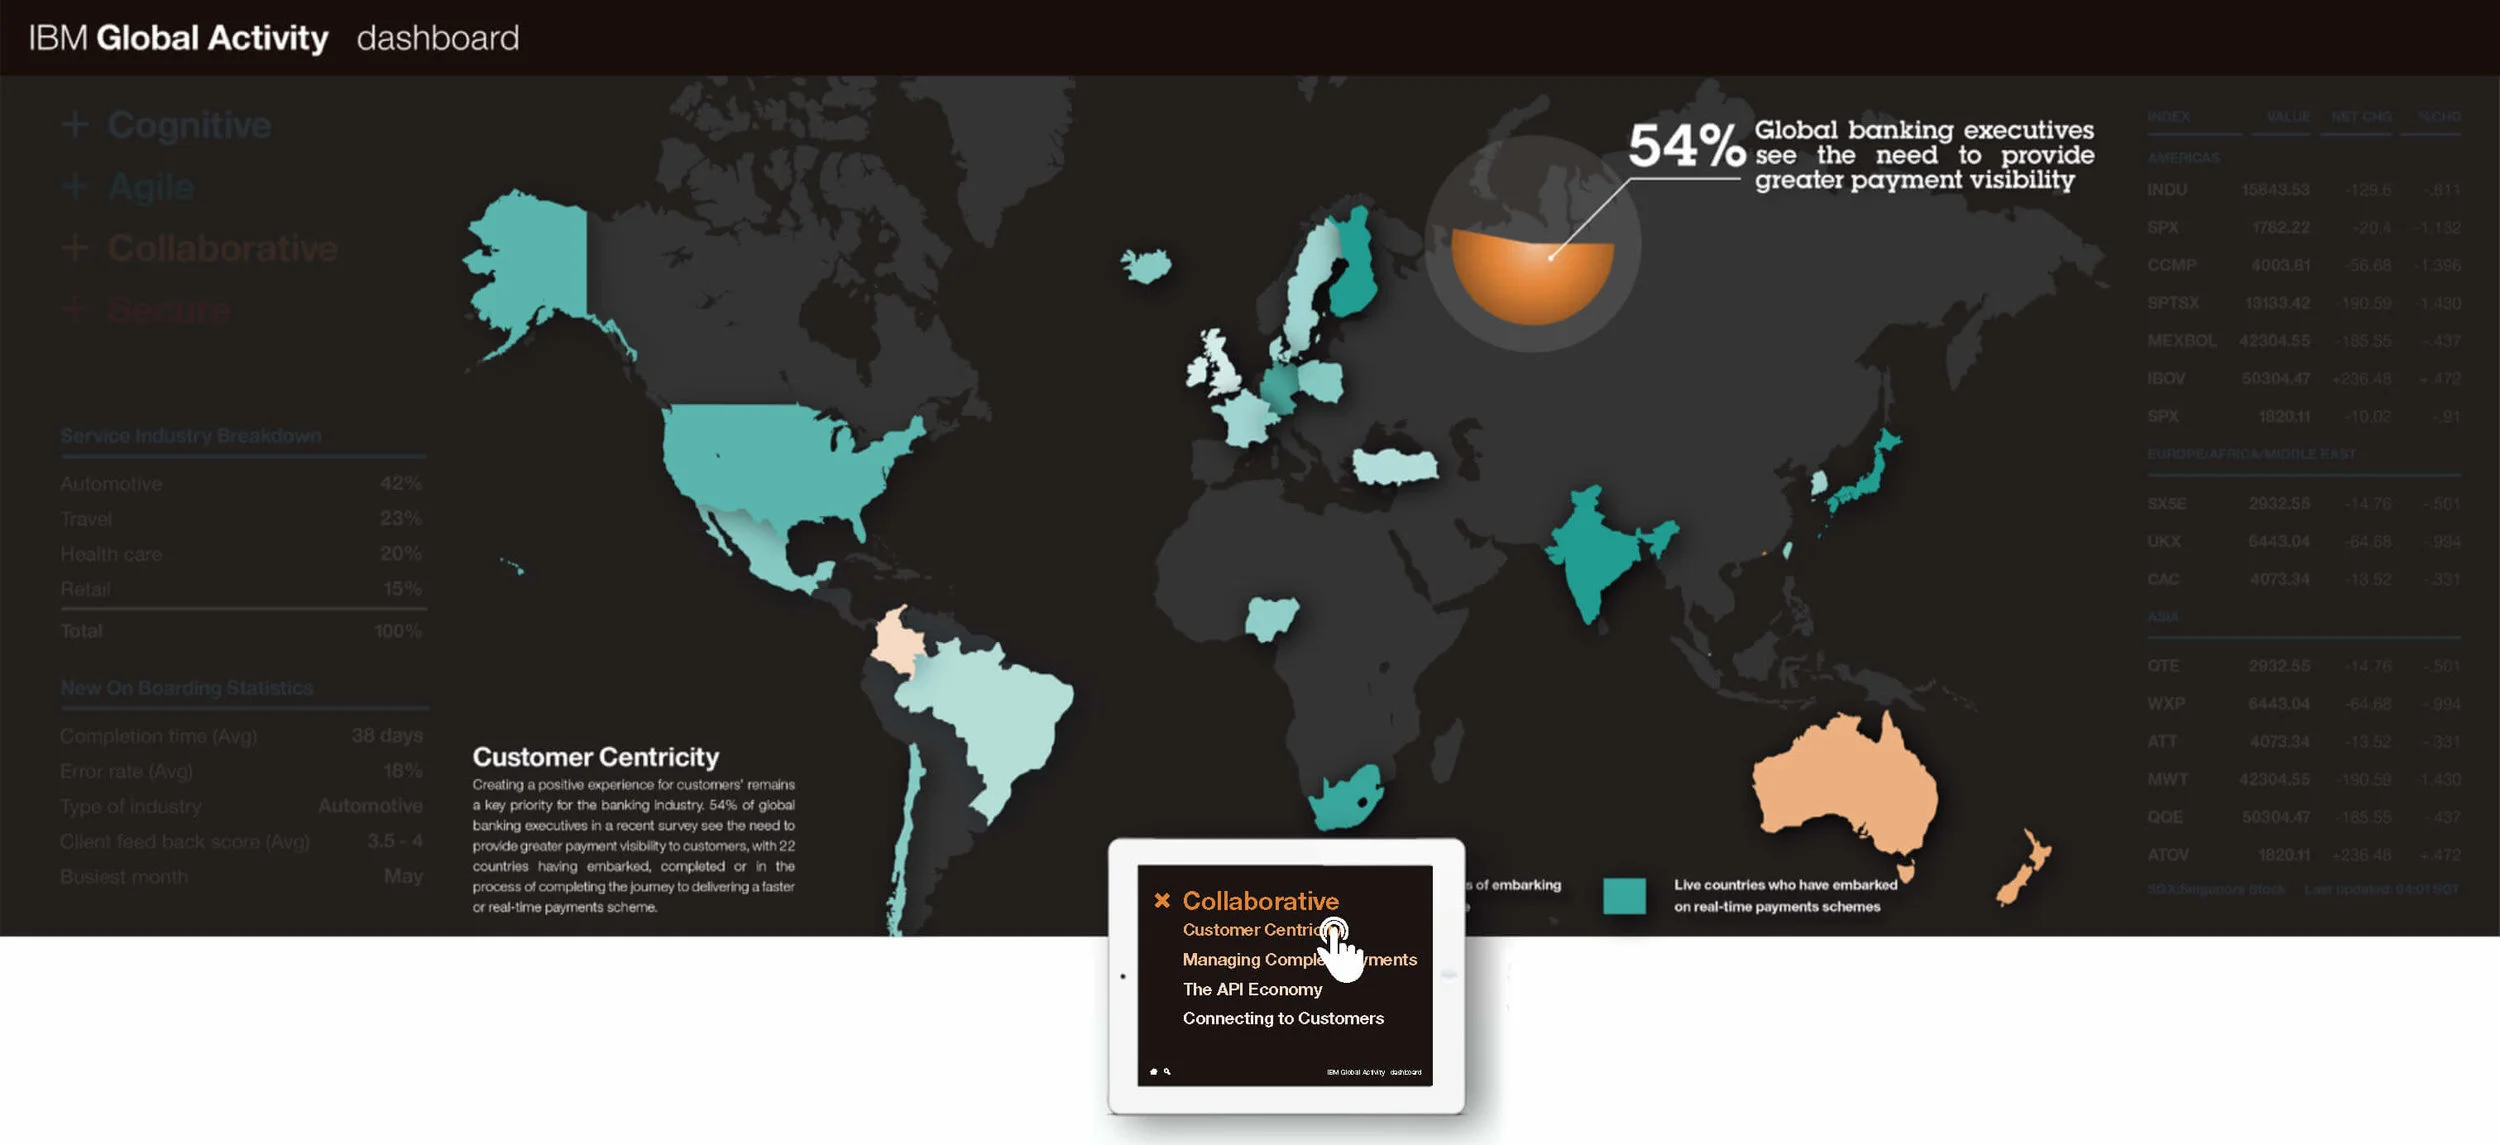
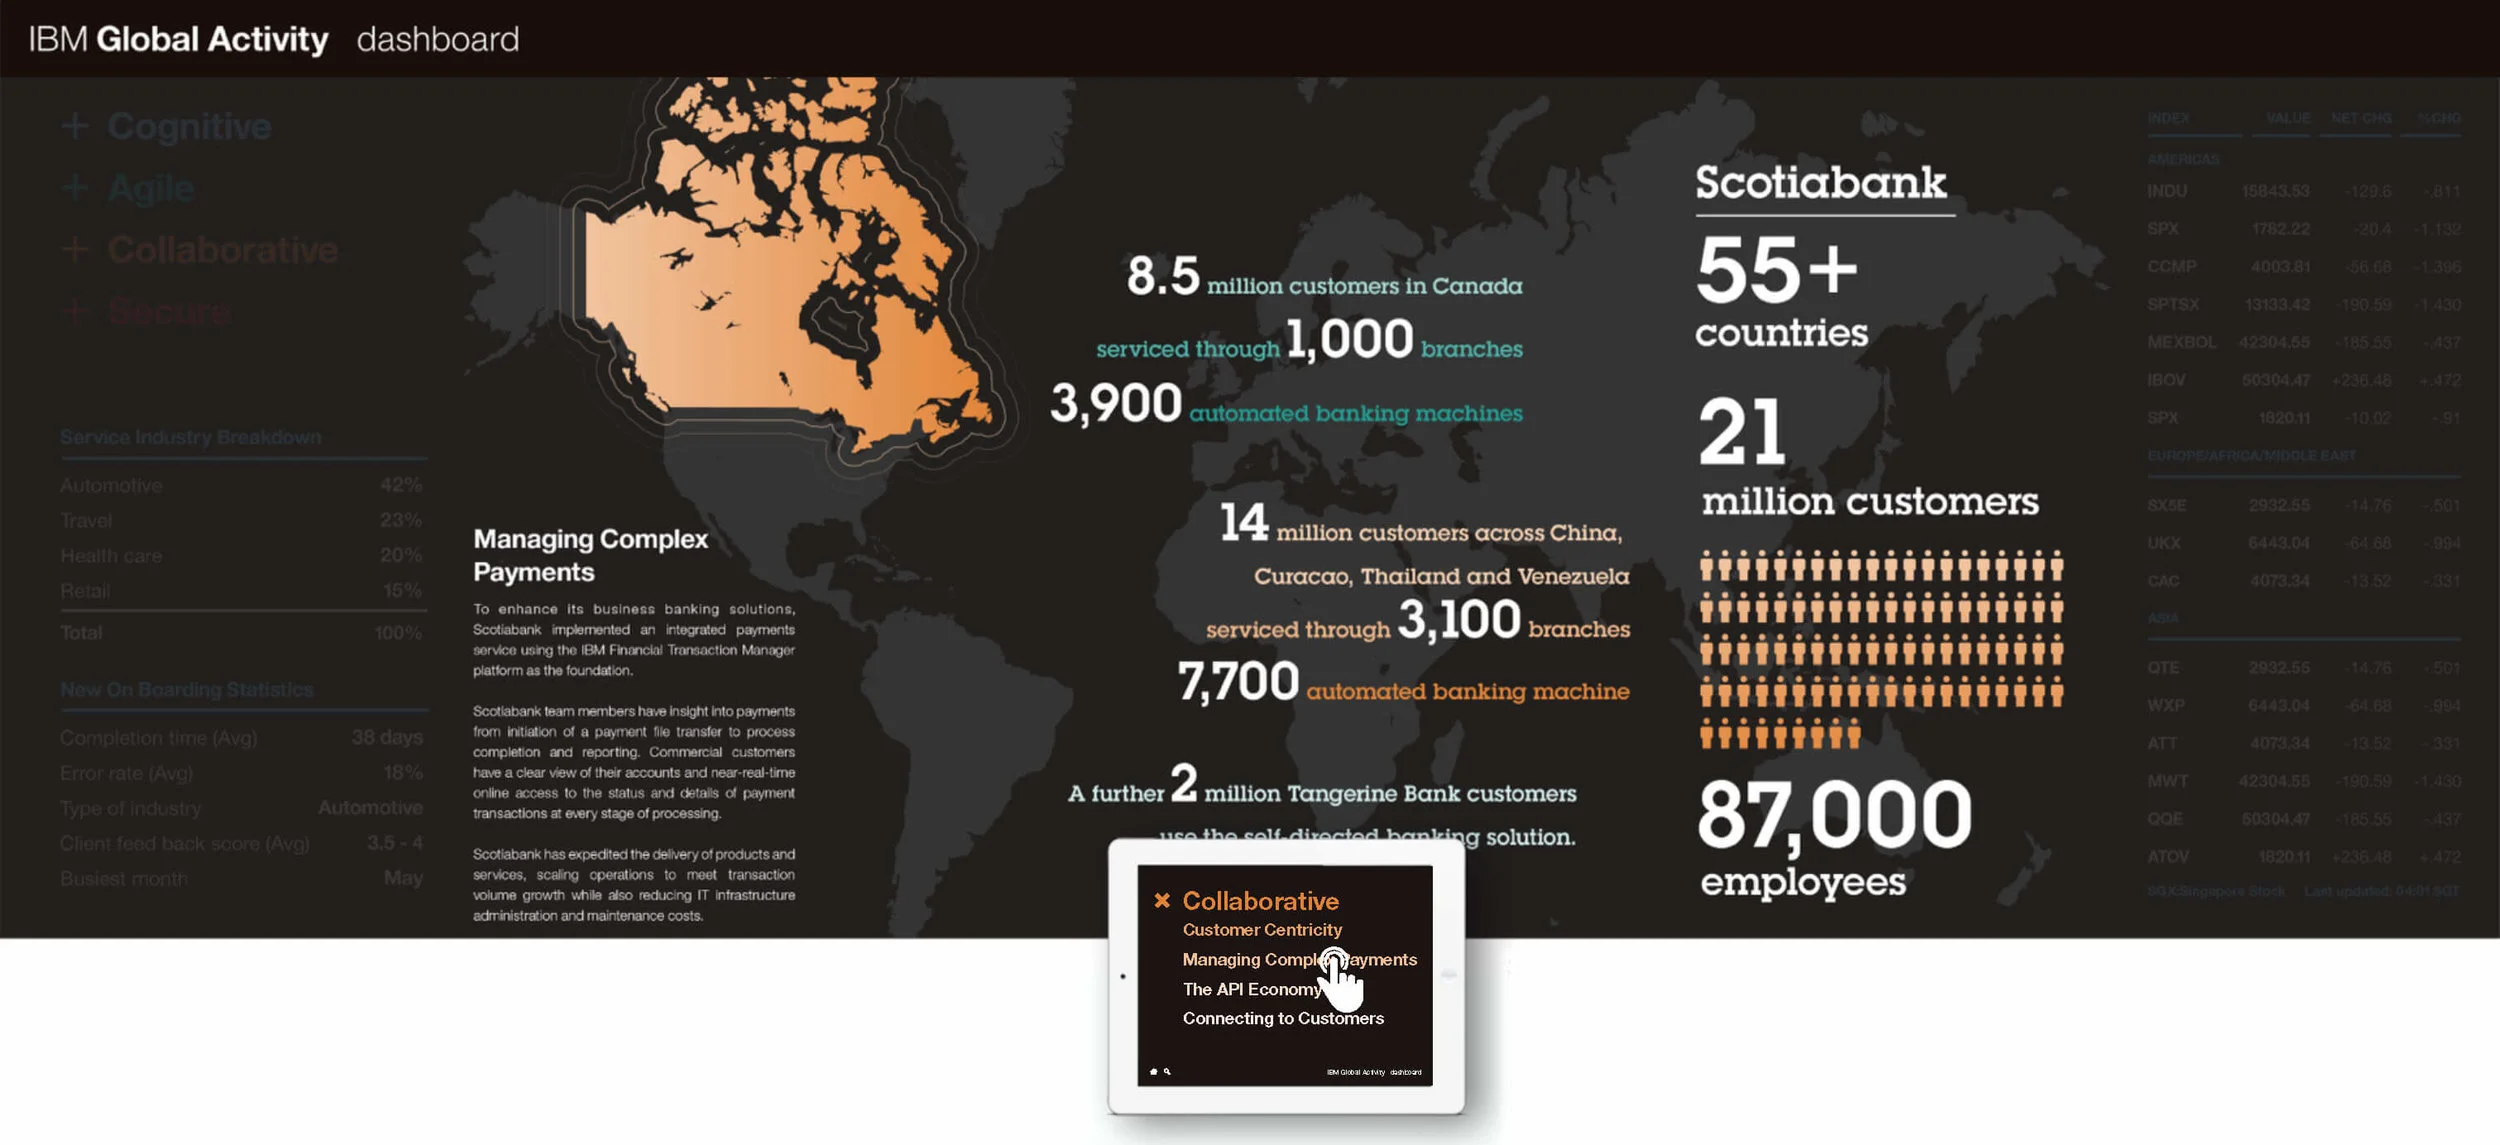
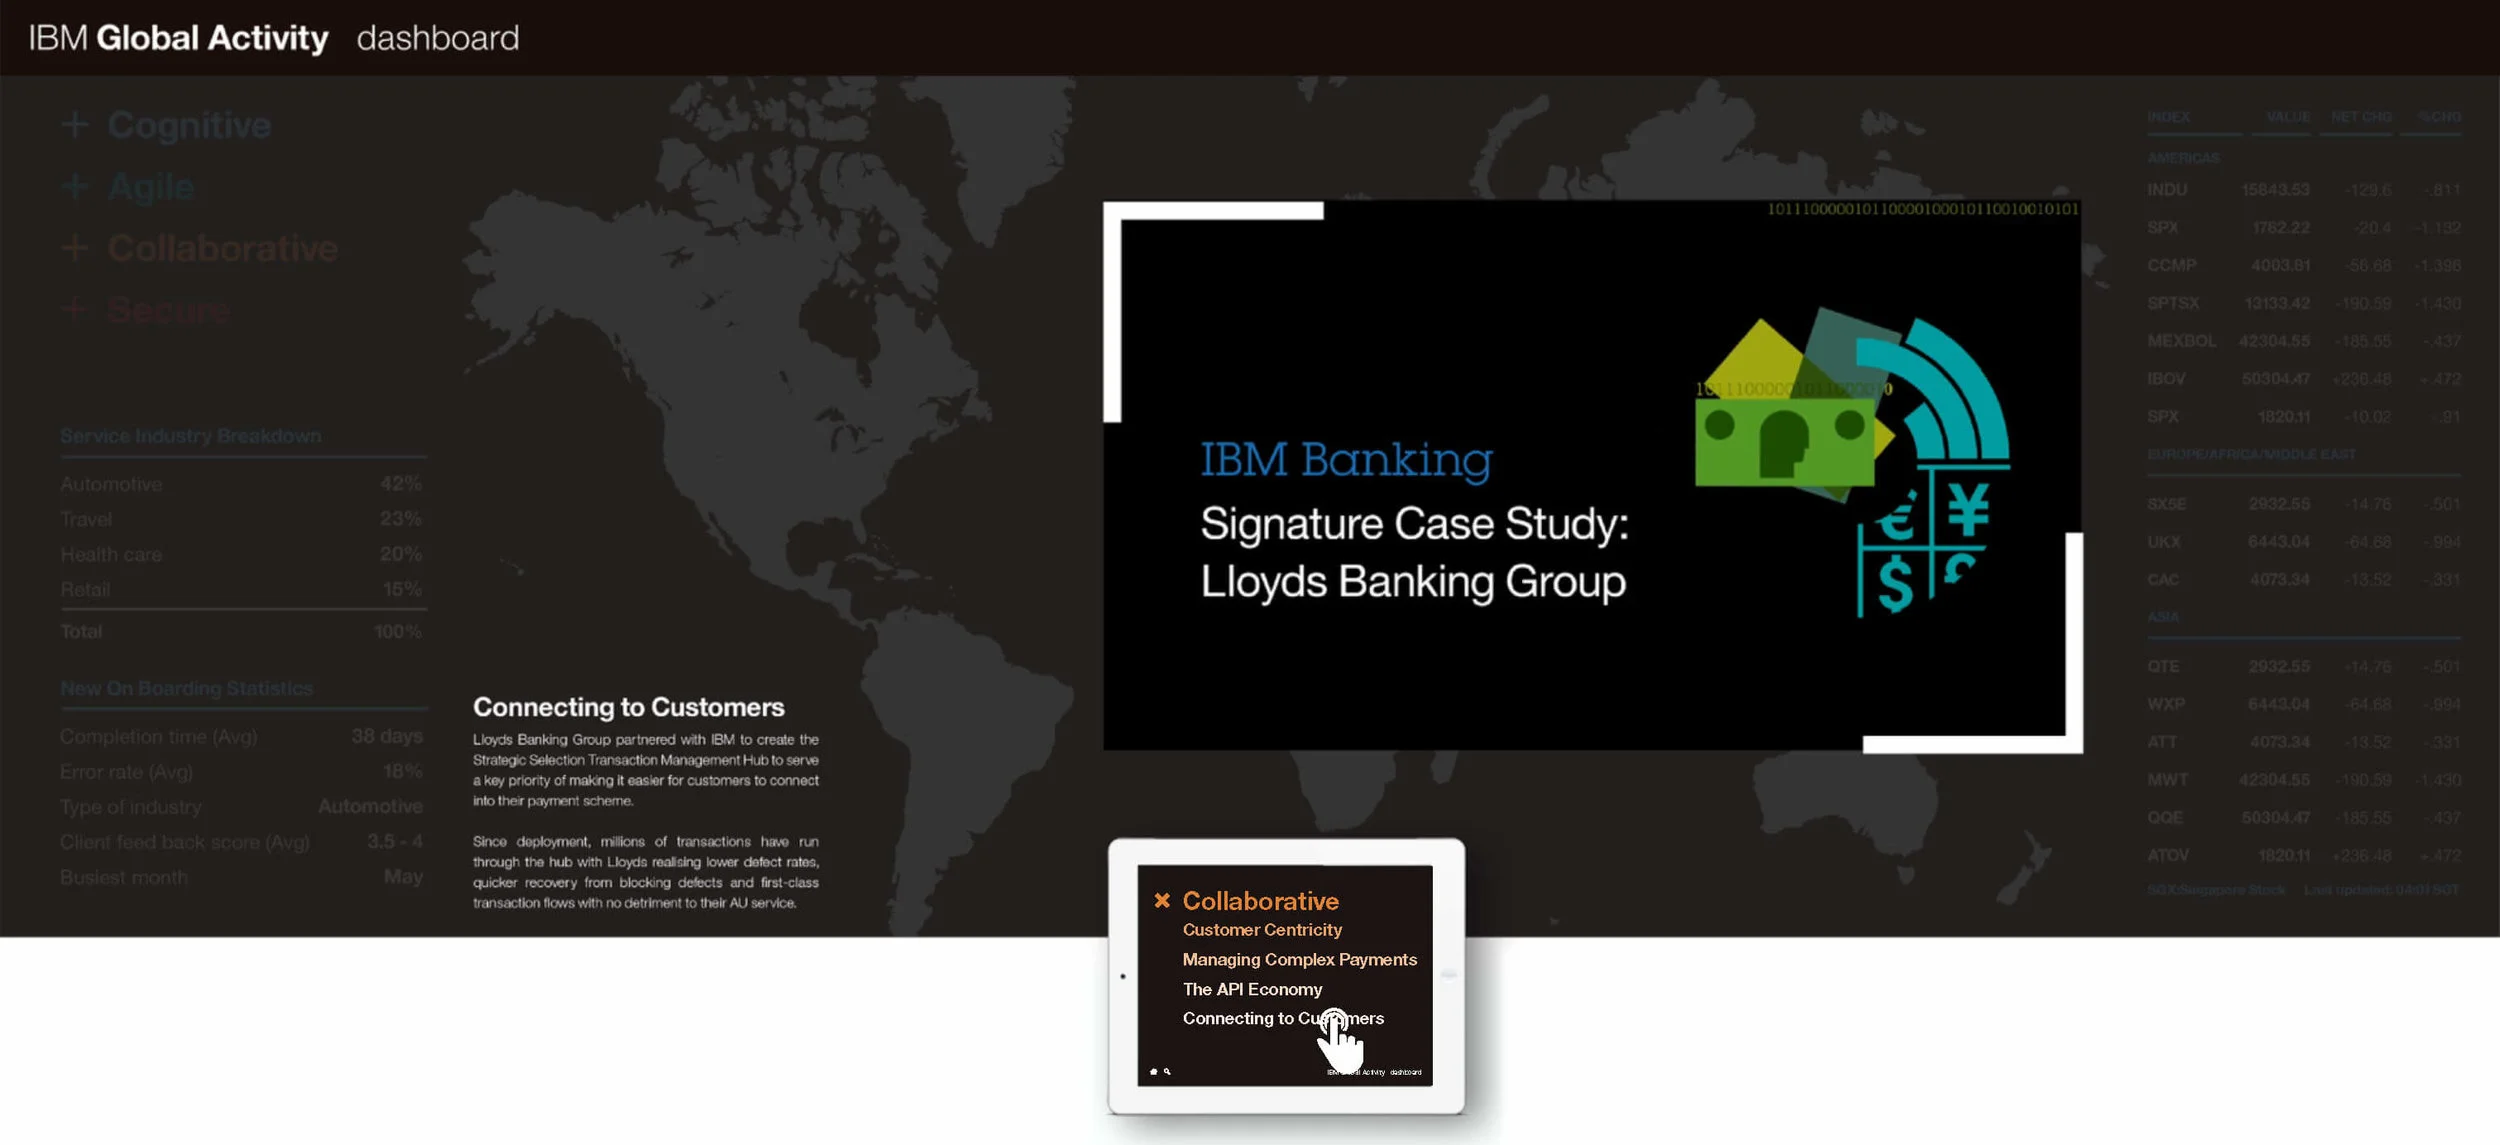
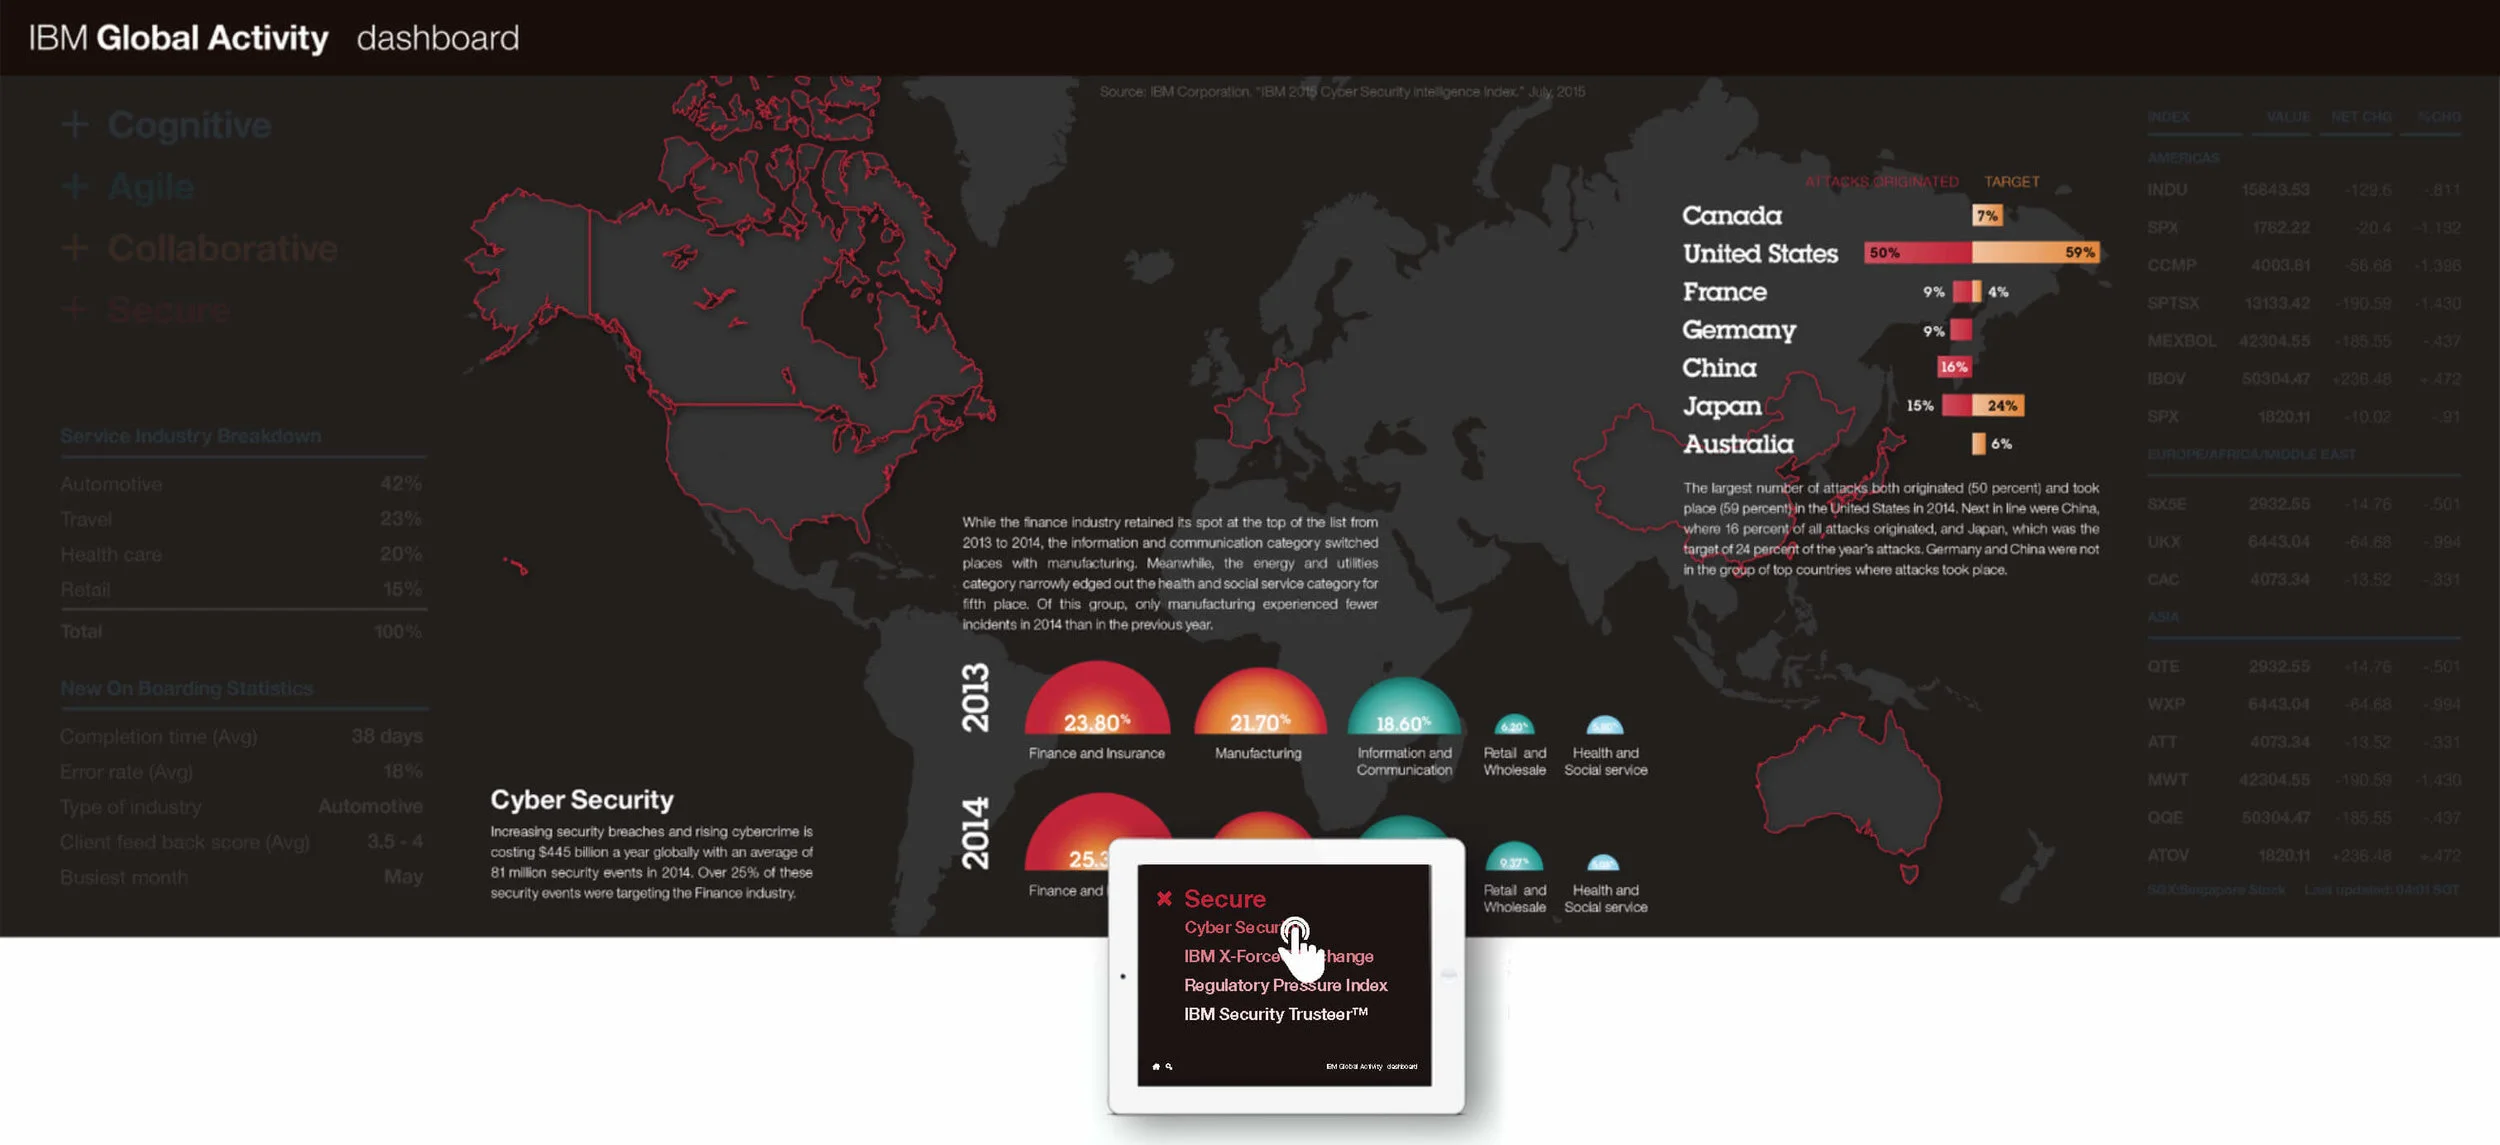
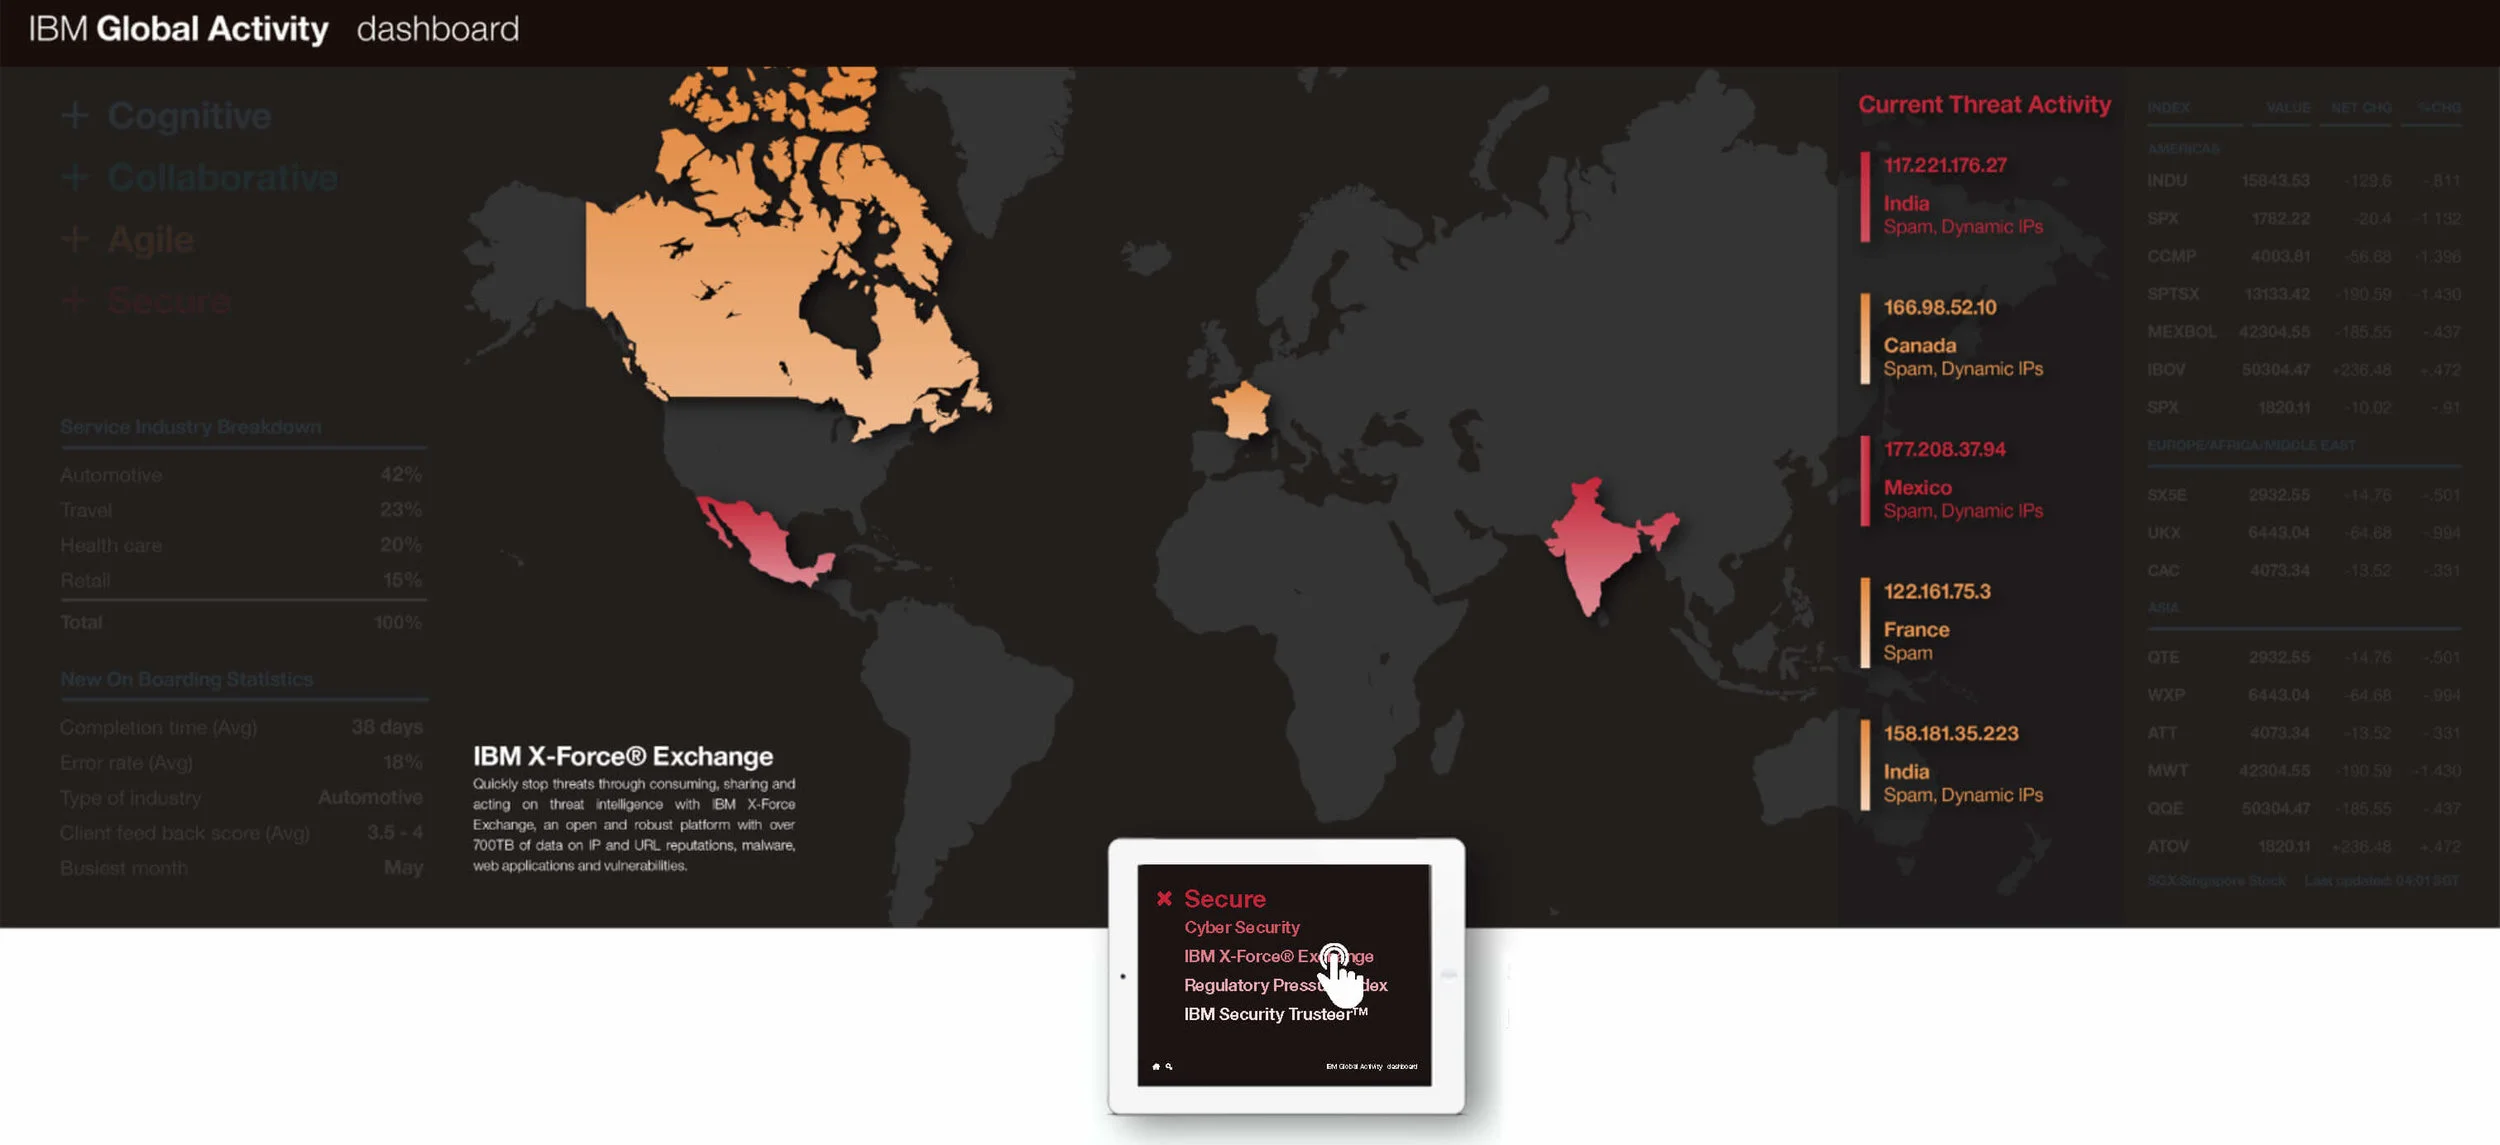
Led UX and Visual Design for IBM’s Sibos Interactive Wall, engaging 8,300 attendees with real-time data visualizations showcasing IBM’s cognitive solutions in finance, cybersecurity, blockchain, and cloud. The intuitive iPad-controlled interface allowed seamless exploration across Cognitive, Collaborative, Agile, and Secure categories, featuring live IBM X-Force threat feeds, stock data, and social media integrations, creating a powerful, data-driven experience for customer engagement.
8,300 attended world premier financial services event from 158 countries.
Sibos an essential event for IBM to share new cognitive solutions and help business transform industries.
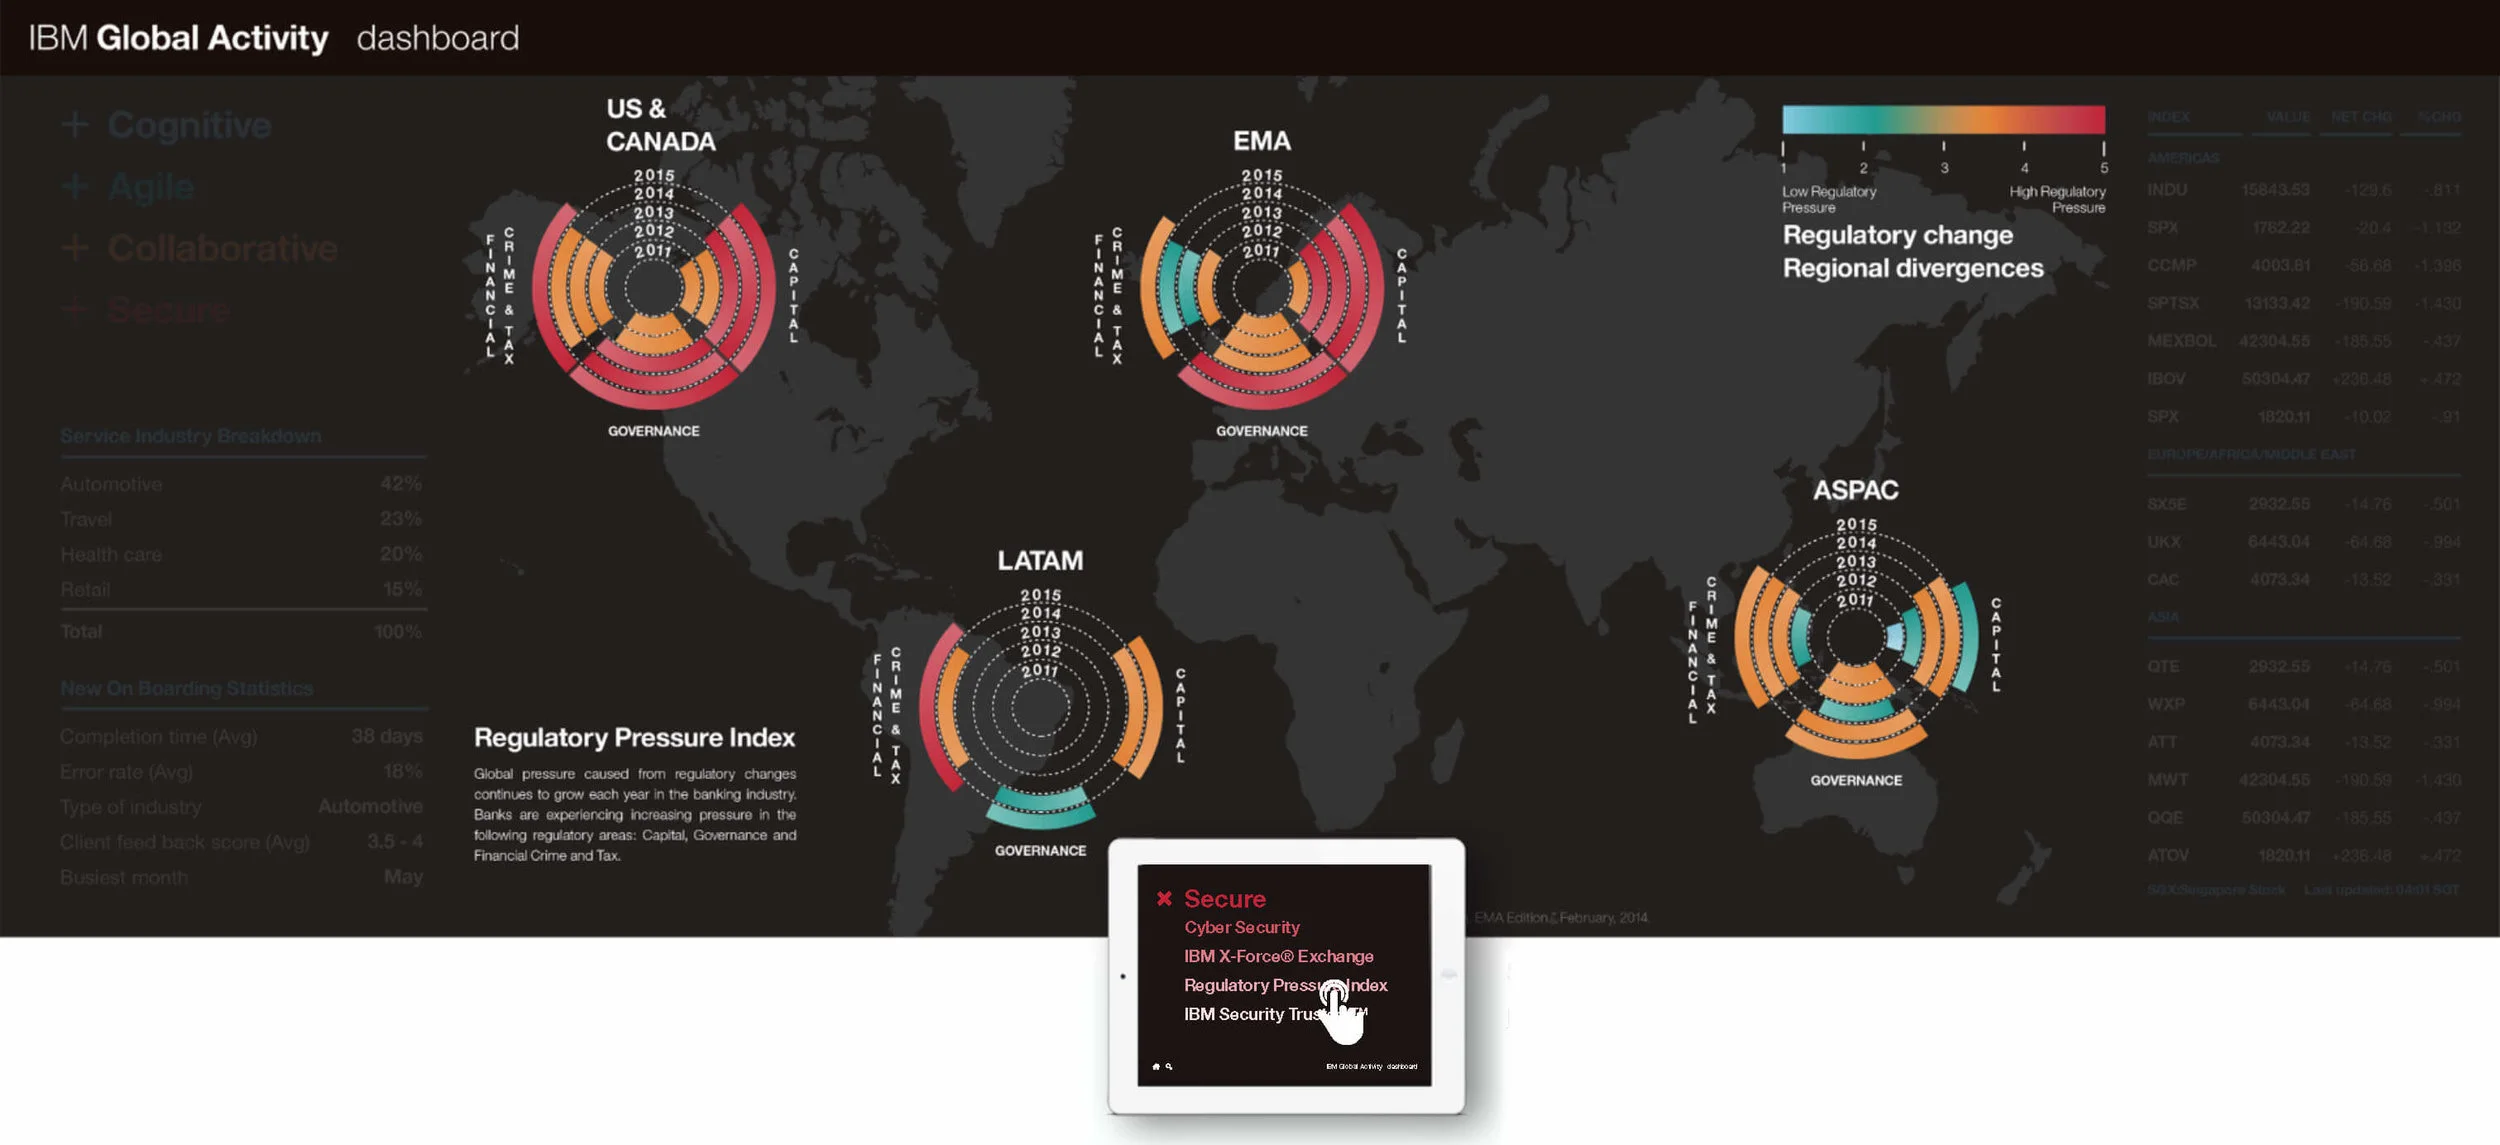
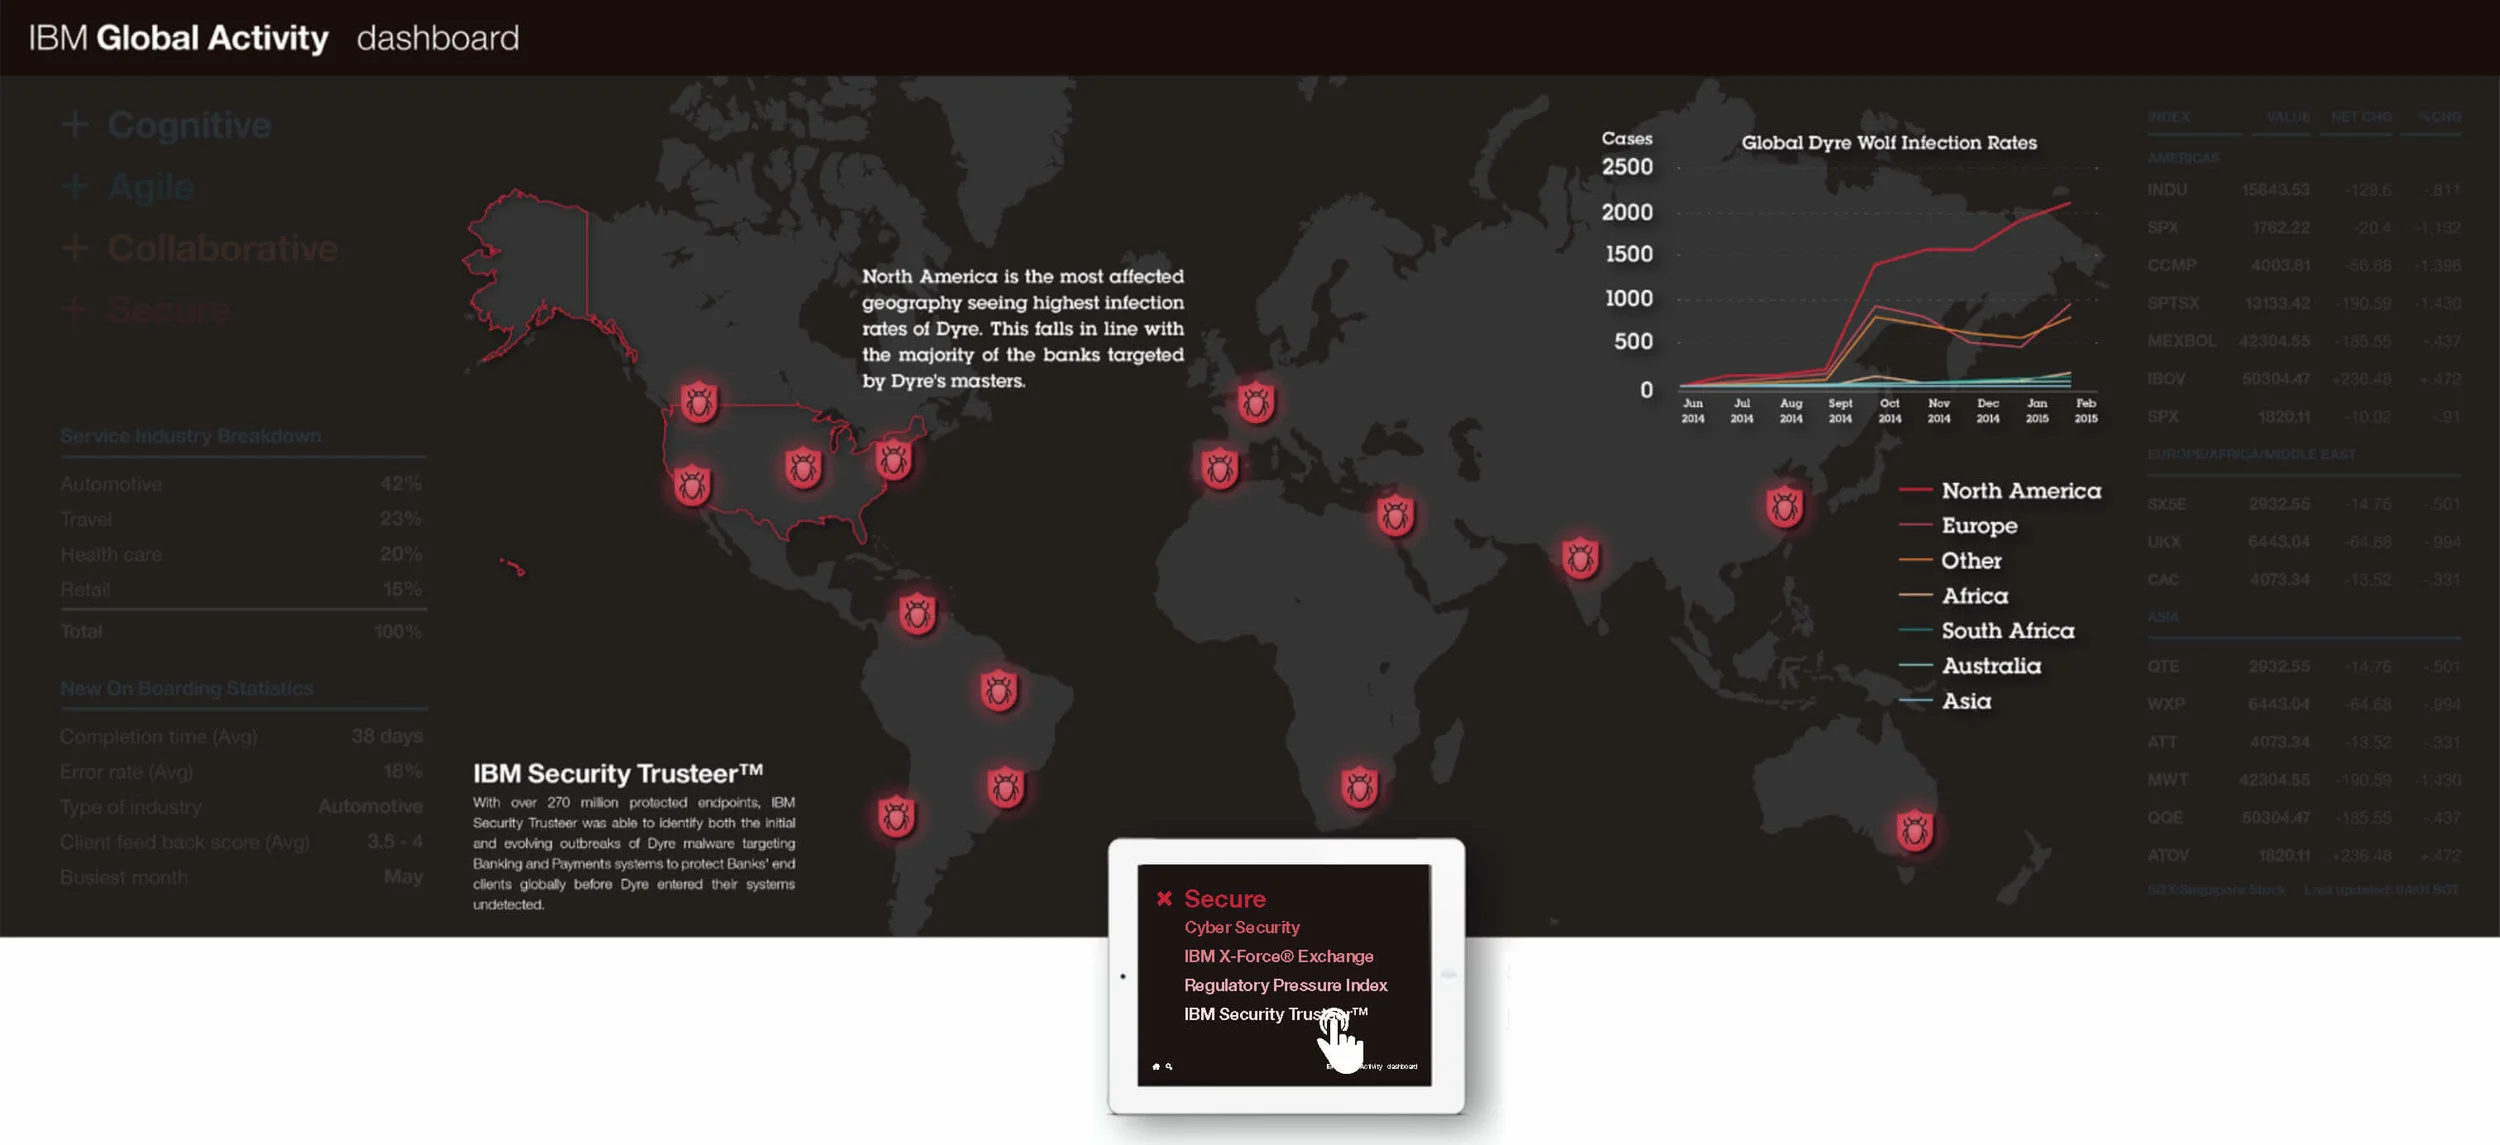
Security Global Activity Dashboard
Controlled through an iPad
Geo-located Case Studies
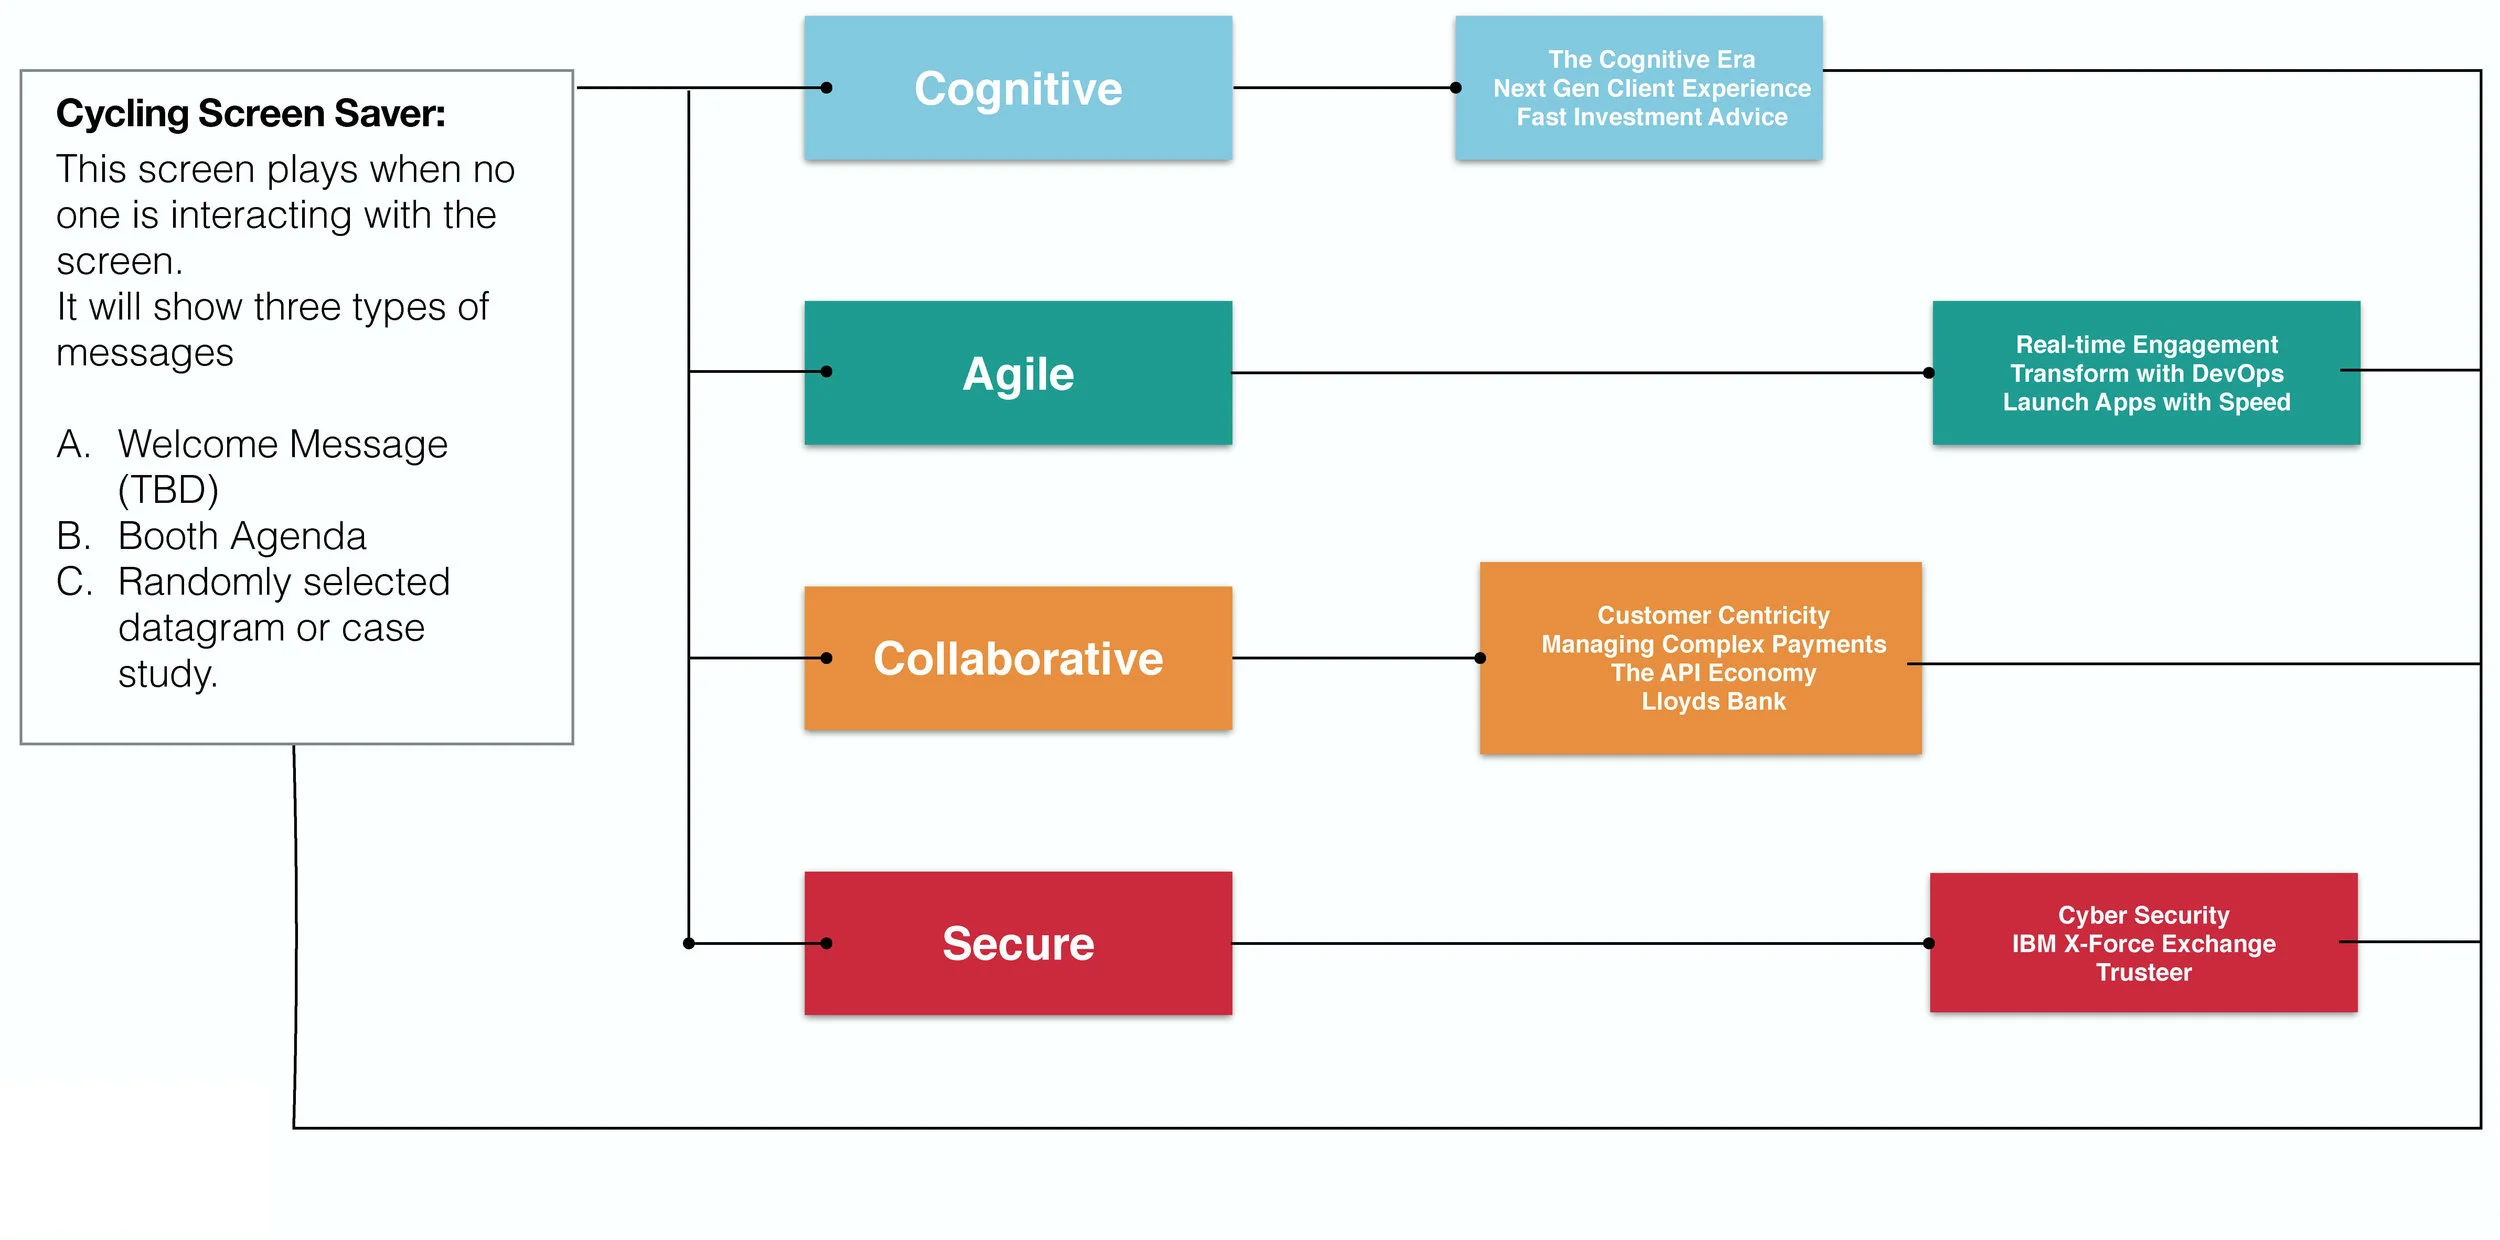
Inactivity loop mode to highlight all assets
Real-time IBM X-Force Exchange Security Threats
Custom Data Counter Visualization
Real-time Stock Exchange Information
Social Channels Integration
Intuitive User experience allowing attendees seamlessly navigate through Cognitive, Collaborative, Agile & Secure categories. On category selection, a submenu drops down with four unique videos and data visualizations.
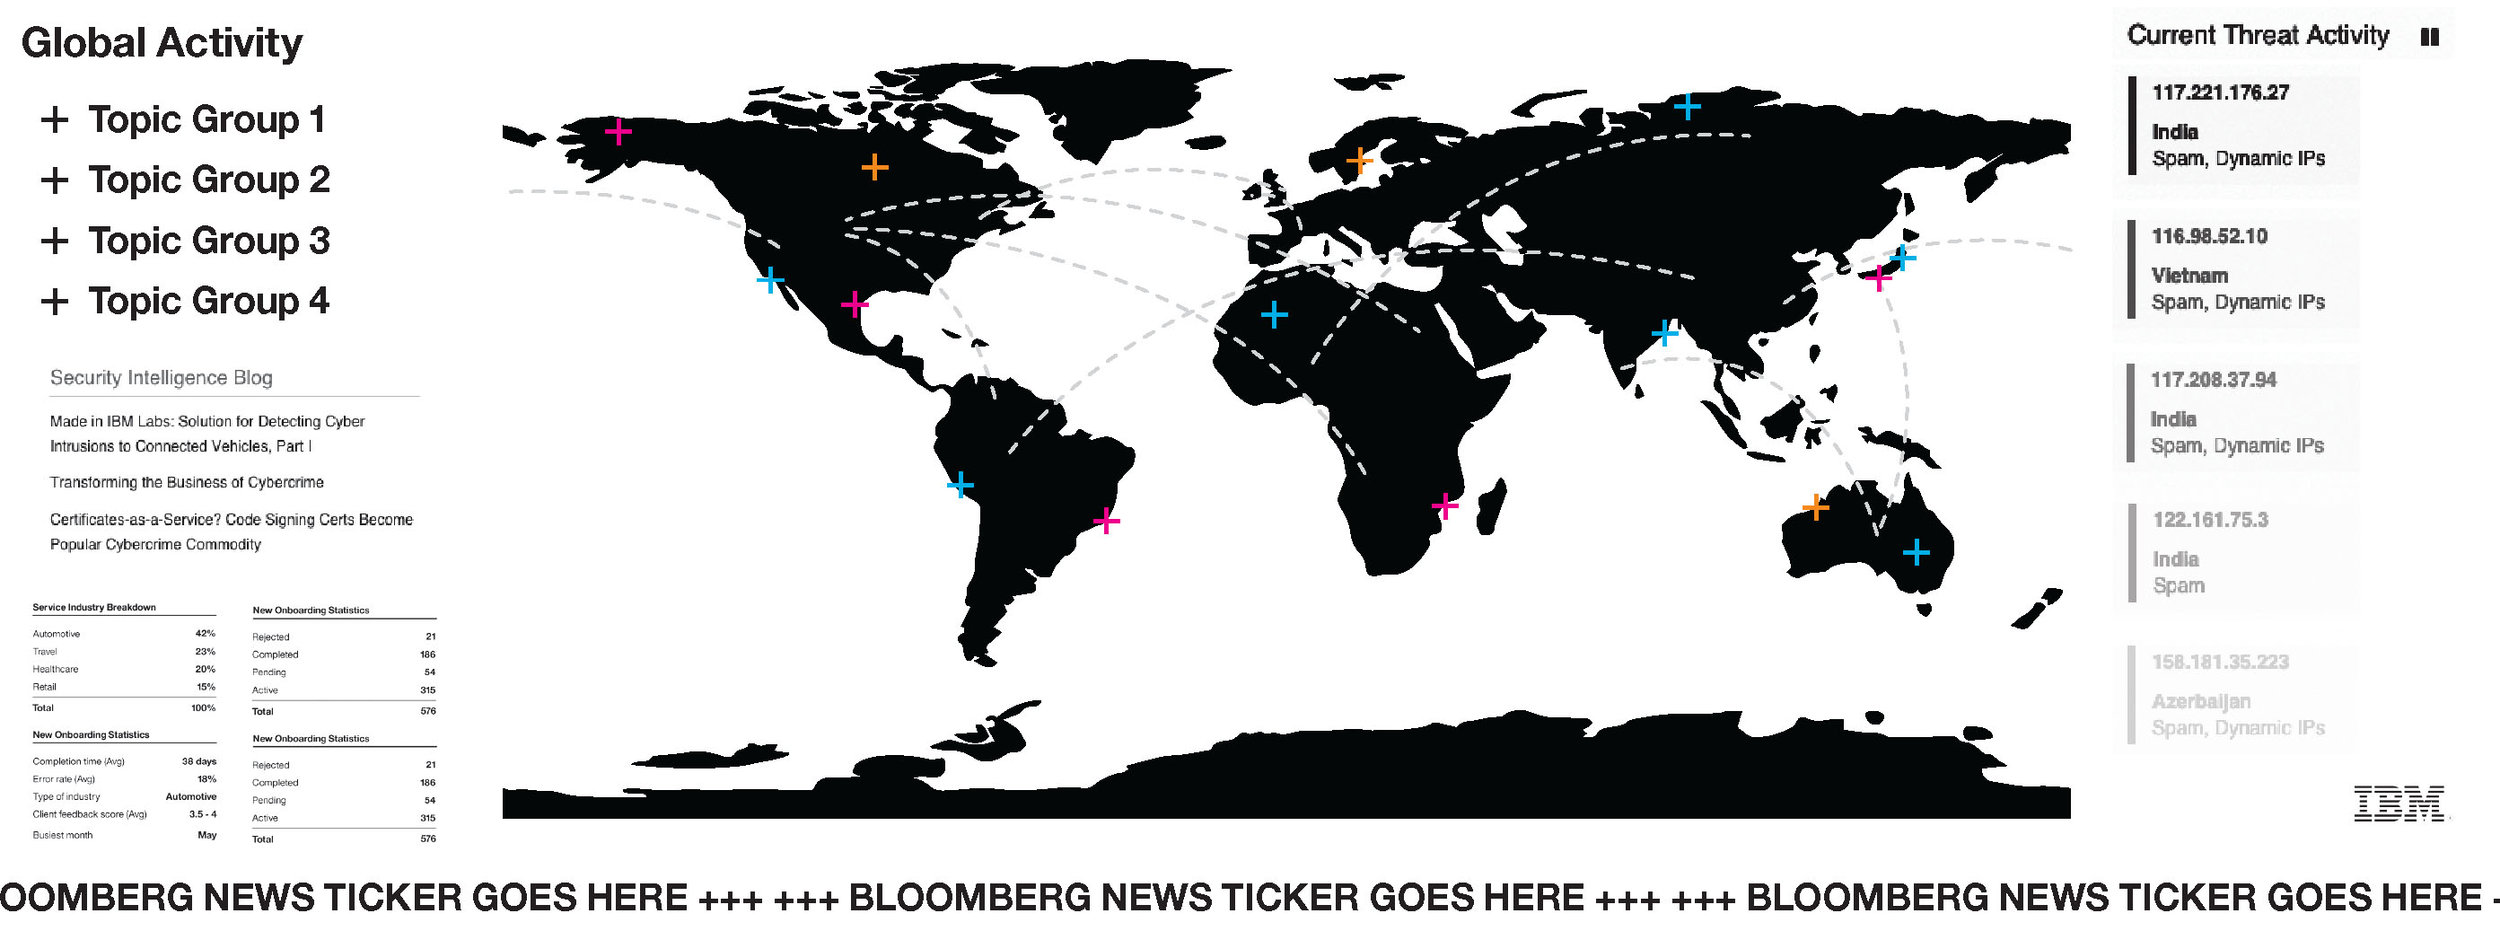
Base Layer — Contains menu and integrated feeds for real-time stock prices and event relevant Twitter posts
Map Layer — Static world finance map used a background for content and data visualizations
Data Layer — Serves up category-specific IBM partnerships, case studies, and animated visualizations
Data Visualizations
Flow and Wireframe
“Sibos is the only worldwide industry-specific event. There are regional ones but Sibos has all the important players from around the world”
Client: IBM
Agency: George P. Johnson + Softlabs
Software: Sketch, Invision, Draw.io, Keynote and Illustrator
Roles: User-interface, User-experience, and Interactive Design


